


Where the world does markets
Join 60 million traders and investors taking the future into their own hands.
Explore featuresExplore featuresExplore features
Trading opportunity. What to buy?In the crypto market, the largest assets are currently experiencing similar situations.
On the charts, we can see that six assets have formed sideways trends. Prices for all six assets are currently at the bottom of these sideways trends. For four assets, the price temporarily dropped below the lo

Why will Ethereum drop toward 2500 levelLiquidity is slowing off Etherum toward Bitcoin as show on the ETH/BTC pair
structure at lower timeframe is respecting the 50% fib level and also trending downward inside the channel , as it repeats is similar pattern!!
Thank you for watching
Follow me for more crypto analysis

Factors Driving Gold (XAUUSD) Prices Up Analysis: Factors Driving Gold Prices Up
Here is why we think it will go up
(FUNDAMENTAL ANALYSIS)
Weak NFP Report and Potential Fed Rate Cuts:
The recent Non-Farm Payrolls (NFP) report came in weaker than expected, signaling sluggish job growth in the United States. This unexpected weak

The TradingView Show - Must-see Charts with TradeStationHello to all the global traders! We're live with David Russell, TradeStation's Global Head of Markets. He's also the one who publishes the research and analysis from the official TradeStation account on TradingView. Follow them here: www.tradingview.com
In today's show, we're discussing the most

Tesla among top 10 losers. Next what?Tesla is the 7th worst performer YTD in the Nasdaq-100. It is the 11th worst performer in the S&P 500. The stock stands 28% lower.
Still, after reaching its lowest level on 22/April, the stock has rallied a remarkable 30%. On 24/April, the stock rallied 12% after the positive earnings call. On 29/

An Exciting Insight into FXOpen's New Hong Kong-listed Stock CFDLook East! An Exciting Insight into FXOpen's New Hong Kong-listed Stock CFDs
Hong Kong has built up a gilt-edged reputation as one of the world's most reputable financial market centres. The city of Hong Kong enjoyed a unique position for many years. It is situated in the Asia Pacific region, very

FTSE 100 : HIGH IN THE SKY- The market still trades above a bullish trend line since mid-February 2024, strongly helped by a decreasing Pound Sterling. The mid-term trend is bullish for UK equities.
- Since the 3rd impact on its bullish trendline at the end of last week, the market has rallied to an hall-time high above 8,0

Technical Analysis: USD/EUR Exchange RateAs of the latest trading sessions, the USD/EUR currency pair displays a complex interaction of technical indicators and price patterns, suggesting a cautious yet potentially bullish outlook. We will break down the technical analysis using various tools and patterns, integrating recent market news in

XRP to 1$We can see a huge bullish Harmonic bat pattern that formed from the 2020 lows to the 2021 highs to the 2022 lows.
On July 13, 2023, the first target price(0.382) was reached.
Now we can look forward to the secondary price target(0.618).
If we look at a longer chart, we can see that a huge trian

See all editors' picks ideas
MARA - Deploy The Lifeboats 😱🙀❗❗Before posting this I did check through the first page of most recent and most popular threads on MARA and it was very interesting to see that every one of them is "LONG" MARA.
So this is a contrarian thread.
And why is that?
Well aside from the skill it takes to make a correct bearish call mid b

$NVDA path to the top - $1170ish targetUpdating my analysis with some additions of some key levels to watch for as price makes it's way higher.
I do think NASDAQ:NVDA is going to become more volatile over the coming few weeks as it works it's way to the top resistance levels.
Even though price seems to be forming a H&S top, I'm not s

$GME Macro breakoutNYSE:GME Macro breakout, from 3 year downtrend on weekly. Previous trendlines sitting below 200D, show historical measured move (Yellow square).

Nvidia - Another push higher from here?Hello Traders and Investors, today I will take a look at Nvidia .
--------
Explanation of my video analysis:
Nvidia stock has been trading in a rising channel formation for a couple of years. We saw the last retest of support in the beginning of 2023 which was followed by an unbelievable rally

AAPL to 189Apple broke out of a symmetrical continuation triangle in a 1-hour timeframe, which is considered a bullish signal. I expect the price to reach around 189 in the short term.

RDDT in a rising wedge pattern with bearish move coming?Strong resistance at $50, with what looks like a rising wedge pattern. Possible bearish movement in store?

Time to comeback on BlackstoneCrossing up several moving averages, RSI moving up, Relative Volume up, all after a double bottom. Looking good.

RIOT Platforms - Corsicana 2024! 🍿🤗🕺Been buying shares of RIOT, and will continue to add shares anytime this gets in the 9s. After a couple bad years of production, RIOT's new Corsicana facility is energizing and the new miners will boost hashrate and increase efficiency. Oh, and lets not forget the 8500 Bitcoin on the balance sheet a


See all stocks ideas
Community trends
MARA - Deploy The Lifeboats 😱🙀❗❗Before posting this I did check through the first page of most recent and most popular threads on MARA and it was very interesting to see that every one of them is "LONG" MARA.
So this is a contrarian thread.
And why is that?
Well aside from the skill it takes to make a correct bearish call mid b
$NVDA path to the top - $1170ish targetUpdating my analysis with some additions of some key levels to watch for as price makes it's way higher.
I do think NASDAQ:NVDA is going to become more volatile over the coming few weeks as it works it's way to the top resistance levels.
Even though price seems to be forming a H&S top, I'm not s
$GME Macro breakoutNYSE:GME Macro breakout, from 3 year downtrend on weekly. Previous trendlines sitting below 200D, show historical measured move (Yellow square).
Nvidia - Another push higher from here?Hello Traders and Investors, today I will take a look at Nvidia .
--------
Explanation of my video analysis:
Nvidia stock has been trading in a rising channel formation for a couple of years. We saw the last retest of support in the beginning of 2023 which was followed by an unbelievable rally
AAPL to 189Apple broke out of a symmetrical continuation triangle in a 1-hour timeframe, which is considered a bullish signal. I expect the price to reach around 189 in the short term.
RDDT in a rising wedge pattern with bearish move coming?Strong resistance at $50, with what looks like a rising wedge pattern. Possible bearish movement in store?
Time to comeback on BlackstoneCrossing up several moving averages, RSI moving up, Relative Volume up, all after a double bottom. Looking good.
RIOT Platforms - Corsicana 2024! 🍿🤗🕺Been buying shares of RIOT, and will continue to add shares anytime this gets in the 9s. After a couple bad years of production, RIOT's new Corsicana facility is energizing and the new miners will boost hashrate and increase efficiency. Oh, and lets not forget the 8500 Bitcoin on the balance sheet a
See all world ideas
SymbolPrice & chgMarket cap
SymbolMarket cap / Price
SymbolPrice & chgEmployees
SymbolEmployees / Price
SPY bigger pictureI am going slowly short.
SPY should make another leg down this week.
Level of interest is 475-470
Lets see what Wednesday will bring, until then we should stay flat.
From the lows of 470, we shall do the usual election run.
target 548?
Ill be updating this idea.

SPY: Week of April 15Last week I just did a longer timeframe update.
I am going to continue with the larger timeframe as the focus but will also give the shorter timeframe levels for next week.
You can see we've just chilled below the 3 month threshold for far too long. It's 504 on the horizon, that's for sure.
We w

TGR pt.2 - SPY vs. gravityThis chart uses symmetric trajectories from the early distribution phases to estimate the path price will take to initiate markdown.
Initial target = 506-508. If SPY finds resistance at 516 then the initial target could hit by the end of this week (5/10). If SPY breaks above 516 it should find res

$SPY May 10, 2024AMEX:SPY May 10, 2024
15 Minutes.
Holding 516, (yesterday low was 516.70) 520 target was achieved.
At the moment i have 2 issues.
Positive is uptrend, above all moving averages, Stochastic black bar on top, did not become red on any pullbacks, Elloitt oscillator green and CCI green.
Negative i


Spy 3-8 Correction, Bear Market, Or Bull MarketNew Thread we have a really big week with Jerome Powell Rate decision this week Wednesday! This is going to move the markets and determine our future outcome for sure
Tuesday April 30th levels for SPY
Bulls 515 and chances are this becomes your territory to go long possible outcome Bull Market R

Spy 🐻🚩Bear flag showing here on spy and a few other indexes/ sector.
This bear flag would be consider a handle for a inverted cup and handle.
Smaller time frame looks like this spy
And heres NQ
We are headed back to bear flag support around 500.. from there we could either finish one more bounce

5/10/24 - MEGA SHORT time sensitive - $jets $qqq $soxl $vixydo yourself a favor and look into this incoming CME from the sun.
youtu.be/9QCA3jouCKk - it's a short video WATCH IT NOW
6 or 7 earth bound flares that each have the capacity to f things up massively.
the reason this matters is it's a DOWN ONLY situation. the market doesn't know about this (clear

$SPY Analysis, Key Levels and Targets for Day TradersTomorrow's Trading Range (5.9.24) and all of the levels going through it.

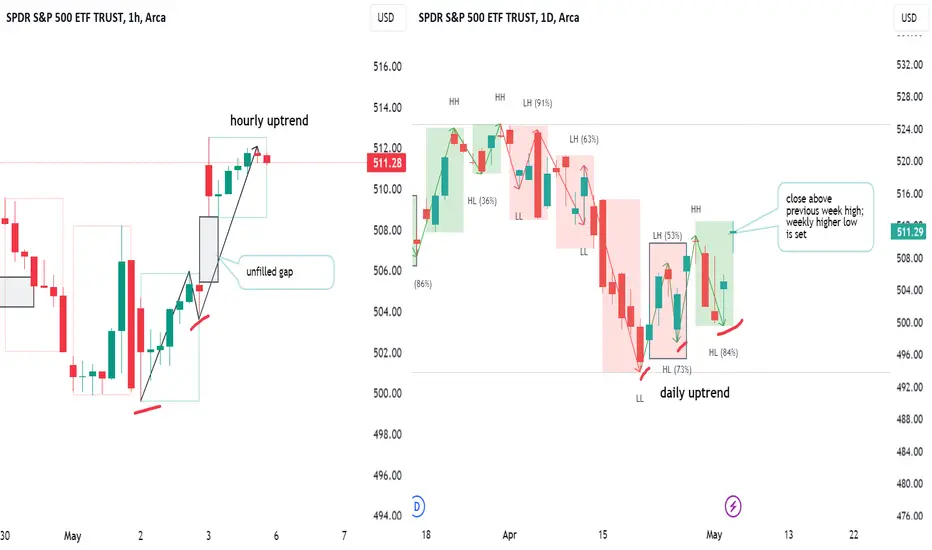
S&P Bulls prove their controlThe strong close last week indicates a shift in control to the buyers. They managed to close above the previous week’s high, establishing a weekly higher low and confirming the daily uptrend. Currently, the bulls have control across all key timeframes: the price is trending upward on the hourly, dai
See all ETF ideas
Community trends
GLD
SPDR Gold TrustNIFTYBEES
NIPPON INDIA MFSOXL
Direxion Daily Semiconductor Bull 3x SharesIBIT
iShares Bitcoin TrustSMH
VanEck Semiconductor ETFYINN
Direxion Daily FTSE China Bull 3x SharesXBI
SPDR Series Trust SPDR S&P Biotech ETFFXI
iShares China Large-Cap ETFGDX
VanEck Gold Miners ETFHYG
iShares iBoxx $ High Yield Corporate Bond ETFSymbolPrice & chgNAV total return 1Y
SymbolNAV total return 1Y / Price
SymbolPrice & chgDividend yield FWD
SymbolDividend yield FWD / Price
BTCUSDT : Prepare to increase prices!Trading strategy for BTCUSDT:
Currently, BTCUSDT is trading around $62,800 USD and showing signs of recovery with support from the $61,000 USD level. The next target is the resistance level at $64,700 USD, followed by $68,700 USD.
I highly favor the buying strategy in the current situation. What a

BTCUSDT: Buy nowHello all dear traders!
BINANCE:BTCUSDT Overall, on H1 we have seen that the trend has shaken and the pressure is leaning towards the buying side. It is currently trading at a new high of $63,250, after hitting $63,435 and up 0.28% on the day
Accordingly, when observing from the chart that the

🅱️ Final Warning: A 50% Capitulation Drop Will Lead To 30KThis is the final warning and a friendly reminder; what we are about to witness is a "capitulation drop!"
This event is not your common drop or "normal correction," instead, it is a major event that only happens once every several years and you have front row sits for it.
➖ If we calculate the ave

Bitcoin is ready to reach 70k! Here is why.Bitcoin has finished its corrective pattern (ABC ZigZag) and is ready to go higher. My next target is 70k (69577) because we have a 1:1 FIB extension level at this price. Usually this Fibo level is pretty significant; that's why I am expecting a small crash from it, but after that, we should continu

Bitcoin to rise in the short termYesterday I said that if the Bitcoin price breaks through 61800, the downward trend may be reversed in the short term. Yesterday the price broke through 61800 and then fell back to 61800 and continued to rise. The highest point was close to 63900. The price is currently correcting.
Judging from the

Trading opportunity. What to buy?In the crypto market, the largest assets are currently experiencing similar situations.
On the charts, we can see that six assets have formed sideways trends. Prices for all six assets are currently at the bottom of these sideways trends. For four assets, the price temporarily dropped below the lo
BITCOIN Another 1D MA50 rejection. More bleeding ahead?Bitcoin (BTCUSD) broke again below the 1D MA100 (green trend-line) after the 3rd rejection on the 1D MA50 (blue trend-line) in almost 1 month (since the April 13 bearish break-out). If it stays unbroken, it is a far from ideal development as the 1-year price action has shown us that such a pattern r

🔥 Bitcoin Inverse Head & Shoulders: Back To All Time Highs!Bitcoin has been trading fairly neutral over the month or so. In the process, an inverse head & shoulders has been formed. This is classically a bullish reversal pattern.
In my eyes, this could be the definitive pattern to shoot BTC back towards the ATH around 73.5k, potentially even making a new A

Opened BTC UP position at 62500 price with 10x leverageHi everyone,
Opened BTC UP position at 62500 price with 10x leverage on Fybit trading platform.
First target at 64400, Second target at 67000, Stop loss at 60600.
Position was opened on 1-hour timeframe. Short-term trade position.
After failing to break 65k resistance BTC price declined up to 605

PHB/USDT Retest is valid, ready for continue upward movement!💎 Paradisers, #PHB is indeed a coin worth monitoring closely. It has successfully broken through the resistance area, transitioning it into a support zone.
💎 Moreover, PHB has also managed to break free from the confines of a descending channel pattern. These developments suggest a bullish momentu

See all crypto ideas
Community trends
SymbolPrice & chgMarket cap
SymbolMarket cap / Price
SymbolPrice & chgTVL
SymbolTVL / Price
EURUSD: Stable price increase on weekends!Hello traders!
An uptrend line is forming supported by a break of 1.0730. It is currently trading at a new high of 1,077 and is down 0.05% on the day.
It can be seen on almost every timeframe that EUR/USD is showing significant gains, indicating a positive outlook.
With EU continuing to trade at t

GBP/JPYGBP/JPY is identified at 194.40, suggesting that traders may want to consider initiating a short position at this level, anticipating a downward movement in the currency pair. The take profit levels are set at 193.50, 193.00, and 192.50, indicating key points where traders might consider closing the

USDJPY - 4hrs ( Sell Trade Target range 240 PIP ) Pair Name : USD/JPY
🗨Time Frame : 4hrs Chart / Close
➕Scale Type : Large Scale
------
🗒 spreading knowledge among us and to clarify the most important points of entry, exit and entry with more than 5 reasons
We seek to spread understanding rather than make money
✔️ Key Technical / Direction (

USD/JPY H4 | Potential bullish bounceUSD/JPY is falling towards a pullback support and could potentially bounce off this level to climb higher.
Buy entry is at 155.33 which is a pullback support.
Stop loss is at 154.84 which is a level that lies underneath the 23.6% Fibonacci retracement level.
Take profit is at 157.03 which is an o

Euro can exit from wedge and rise to resistance levelHello traders, I want share with you my opinion about Euro. Looking at the chart, we can see how the price broke the resistance level, which coincided with the seller zone, made a retest and even soon rose higher. But after this, the EUR turned around and started to decline inside the downward chann

EURUSD Technical Analysis and Trade IdeaThe EURUSD is exhibiting a bearish sentiment on the weekly timeframe; nevertheless, there is a noticeable robust bullish trend observed on both the daily and the 4-hour timeframes. Notably, we witness a pronounced reaction at the weekly levels identified as resistance on the chart. Furthermore, we h

EURUSD BUY ModelEURUSD has presented a critical low as price trades inside an hourly FVG. From here price is presented with a bullish bias targeting previous equal highs at 1.0782.

Buy GBP/CAD UK GDPThe GBP/CAD pair on the M30 timeframe presents a potential buying opportunity due to a recent upward breakout from a well-defined bullish channel pattern. This breakout suggests a shift in momentum towards the upside and a higher likelihood of further price gains in the coming hours.
Key Points:

🚨GBPUSD: What's Next? BOE leaves policy rate unchanged at 5.25🚨GBPUSD: What's Next? BOE leaves policy rate unchanged at 5.25%
🚨BoE left the policy rate unchanged at 5.25% as widely expected
The price is also facing strong support near 1.2450.
How can the price react in this area?
Be careful as GBP can get stronger when you least expect it.
It reacted lower

Lingrid | EURUSD pulled back to CONSOLIDATION zoneAfter the recent news reports, the market rolled back to the consolidation zone. Now, it's heading towards a significant resistance level, but it's not looking likely to break above Monday and Tuesday's highs. In fact, I think FX:EURUSD will likely bounce back and fall, as the market has been stuc

See all forex ideas
⭐️ XAU/USD : Ready for LONG ? (READ THE CAPTION)Upon reviewing the gold chart in the 2-hour timeframe, we observe that the price, following last night’s analysis, has rallied once again, soaring to $2319! However, it wasn’t long before it encountered selling pressure and has corrected to $2307 as of this moment! As I mentioned in the previous ana

Gold has formed a higher lowIn my Monday commentary, I stated that there is a high likelihood that OANDA:XAUUSD may have finished correcting, and indeed, the price rose to around 2330.
After this initial increase, there was a subsequent drop, but bulls regained control just above the 2300 mark.
Yesterday's price movement i

Update the latest gold price todayHello dear traders!
Overall, gold experienced significant volatility yesterday with price gains surpassing $2,328 in a wedge pattern continuing the technical uptrend. It is currently trading at a new high of $2,353, marking a 0.2% gain on the day. So what are the reasons and factors driving gold?

GOLD ROUTE MAP UPDATEHey Everyone,
Once again another smashing finish to the week with our Bullish targets hit confirmed with ema5 lock to give us plenty of time to get in for the action.
Yesterday after getting our lock confirmation above 2313 we confirmed the 2340 gap, which was left open and just fell short and we

GOLD → The correction is ending. Rally to 2400FX:XAUUSD is moving from the consolidation phase, to the phase of realization of accumulated potential and rallying to 2400. The price enters one of the key ranges.
The fourth wave of correction is coming to an end and a rally within the V wave is being formed. The potential target could be 2400

Lingrid | GOLD Retracement followed by EXTENSIONThe release of new data triggered a surge in the OANDA:XAUUSD market, propelling it above the critical resistance zone at 2350. This break also cleared the previous week's high, which has now transformed into a support level. In my opinion, the ideal scenario would be a retracement to the broken l

Gold under one of the many aggressive Bullish spikesAs discussed throughout my yesterday's session commentary: "My position: As Gold is isolated within Neutral Rectangle on smaller charts, I am not hesitating to utilize the sequence to it's maximum and await final #2,300.80 benchmark break which may extend the Selling sequence all the way towards Dai

XAUUSD: 9/5 Today’s Analysis and StrategyGold technical analysis
Daily resistance is 2320-26, support below is 2300-2293
Four-hour resistance 2320-26, support below 2300-2280
Gold operation suggestions:
Judging from the current trend of gold, the upper resistance today focuses on the opening of yesterday's decline near 2320-2325. The intr

XAUUSDHello traders ,what do you think about GOLD?
After breaking the 2333 resistance zone, gold grew as expected until the next resistance zone of the 2370 zone. In this zone, it is expected to grow at least up to the specified levels after a correction and pullback to the broken level.
If this post was

THE KOG REPORT - UpdateEnd of day update from us here at KOG:
Yesterday we longed up into the order region and then shorted from the RIP, protecting our trades overnight and taking partials. We suggested two levels to long or short from but said breaking above will take us into the 2370-75 region. The move happened ea

See all futures ideas
Huge potential implications from YIELD SPREADS (US10y-DE10y)Folks know how I feel about very long term (multi year/decade+) outlook for inflation and yields - they are going higher.
And I have called for higher yields (and spreads) and thus dollar so far this year.
BUT BUT BUT
The yield spread chart is suggesting a potential divergent high which could hav

UK Bond Steps and ForcesThis is my perspective on the forces that might apply on the UK 10Y Gilt. It can climb along the red rectangles to fall down to the big green or if the first red rejects it or the bottom arc attracts it, we might see support in that area. The vertical green is a special one where unusual or special

US10 yield is "far" from long term "peak". 9/May/24US10Y > 8% what happen for those house/ car mortgage? What happen to #gold when big player have "guaranteed" in bank deposits? What happen to "healthy" bank's "stock"?..

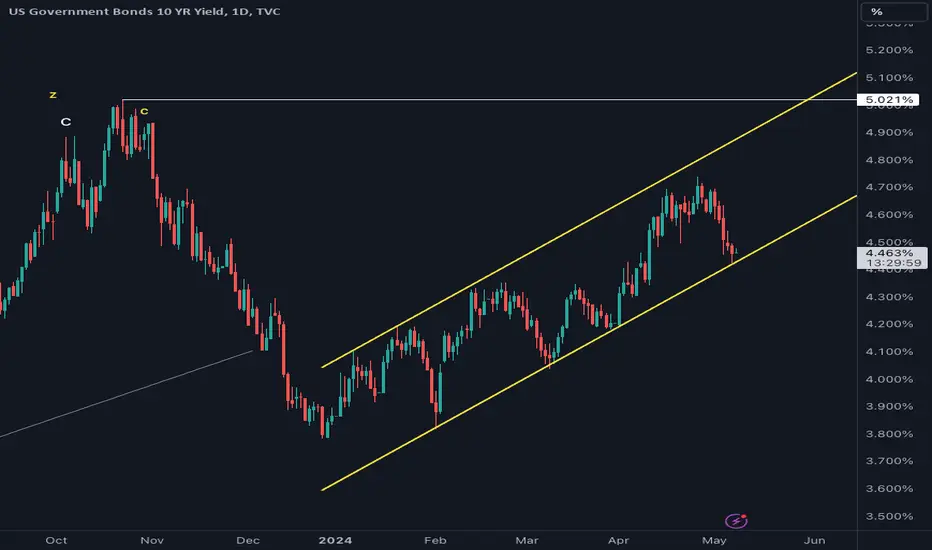
US 10Y yield key support under pressureWe suspect that the US 10Y yield chart has topped short term having tested and again failed at its previous uptrend at 4.74 (which is now acting as resistance) . Please see the weekly chart.
This throws the spotlight on key nearby support where we find a short term uptrend, last week's low, the 55-

stagflation pattern or parallel channelrate is moving up in yellow parallel channel
lower yellow line is working as perfect trend line
in recent may fomc fed has said he neither see stag or flation
if there are no hike in future then lower trend line must break
if second wave of rate hike is coming then trend line must hold and it can
US10Y - Bullish Sentiment ShiftWith predominantly bearish price action during the week, intraday sentiment is more shifted towards a continuation to the downside at this current time.
Due to higher time frame narrative, I am looking out for a retracement to 4.563% hourly fair value gap.
Candle body closure below 4.455% will neg

US02Y Next Move The matter still requires deeper analysis, despite the absence of wide-ranging movement today. The recent decline in bonds did not help boost gold prices. The yield on the two-year US bond is currently at a support level of about 4.8% on the one-dimensional chart and may look to rise. If the Federal

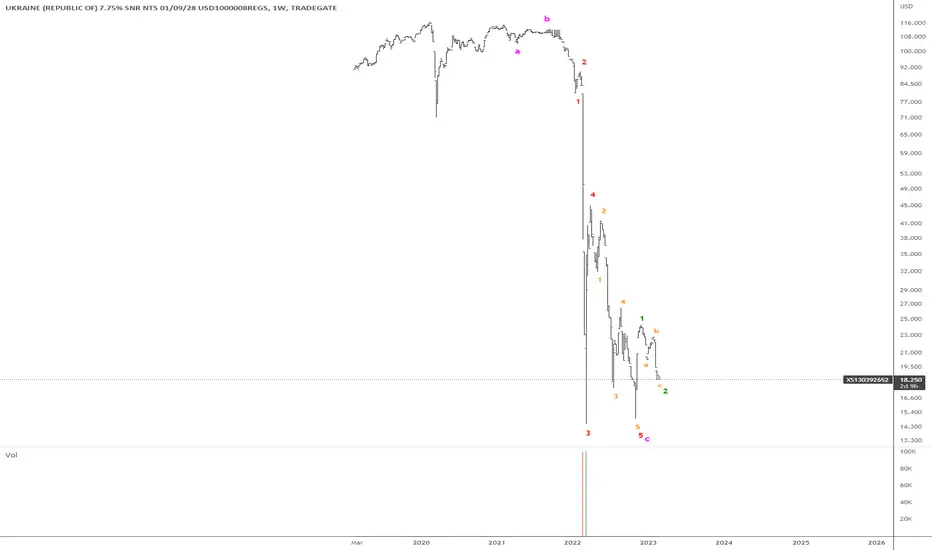
Ukraine bondsThere is clear 5 wave impulse down and clear initial impulse up which has a-b-s correction. What else needed for long?
US10Y 2024 FULL YEAR FORECASTI will start forecasting full years in advance
and provide updates from there finally understand how the bond markets works
dont be fooled folk 2024 nasdaq is crashing market is overbought the recovery was too quick
easy come easy go and only the informed are preparing their shorts
if u appreciat

US 10Y TREASURY: space for further relaxation?During the previous period the market was trying to price its expectations of a less than three rate cuts during the course of this year, giving up on the Fed's announcement from the latest FOMC meeting. The meeting held on May 1st, showed that the market was right in its assumptions, considering th

See all bonds ideas
Trade directly on the supercharts through our supported, fully-verified and user-reviewed brokers.


