Adani Power Looks Interesting.NSE:ADANIPOWER
Adani power near its major resistance level spending too much time on lucratively lower volume compare to its past up move.
I will get interested only if stock manage to give any closing above 41.6 on daily chart.
ADANIPOWER trade ideas


Adani PowerAdani Power has given break out of Upper Bollinger Band on Friday-07/08/2020 and today confirmed also with increase in volumes and Interestingly the breakout happened after squeeze. This may well be a new trend direction indicator Prior Squeeze period was for last 17 Days, so we expect a target of 39-41.9-43.5 in next 7-15 days.

Breakout The stock has been trading in a narrow range since a long time now and in the last trading session we witnessed bulls taking over and a strong closing. A quick upside of atleast 10% can been seen in this counter....

Lets look dayily chart in Adani power NSE This is my first drawing i have seen in adani power daily chart it is forming triangle pattern

ADANI POWER - Triangle BreakdownNSE:ADANIPOWER gave a triangle breakdown.
Let it move further down to short, as a possibility of fake breakdown is there too.

Adani Power - Range Trading Strategy Adani power is trading on Uptrend now and in the chart i have shown that the Price is very near to support level. The line is Trend line near the end point, Wait for the Price to cut across Trend line and Breach support line. Trade only after Trend line is breached and support resistance is crossed. It could give 10-12 % Up-move from the Level


Adani Power - Don't Miss Power in the Cup- Portfolio Stock at 40Disclaimer
-----------------------------
All investments involve risk, and the past performance of a security, industry, sector, market, financial product, trading strategy, or individual’s trading does not guarantee future results or returns. Investors are fully responsible for any investment decisions they make. Such decisions should be based solely on an evaluation of their financial circumstances, investment objectives, risk tolerance, and liquidity needs.
----------------------------------------------------------------------------------------------------------------------------------------------------------------------------
(Last Price - 42.10 - 11:52 Hrs / 11th March 2020)
Doing it from the vacation spot. Another portfolio stock which one should not miss. Stay classy until next update.
Adani Power forming a traditional cup & handle pattern whose handle is running or almost completed at recent low @ 40's - Don't miss the power if you get it specially in the cup.
Kindly consult your financial advisor before considering this stock as part of your portfolio.
------------------------------------------------------------------------------------------------------------------------------------------------------------------------
2nd July 2019 -Waiting for handle to complete close to 40-45 zone from the tops of 70's
-----------------------------------------------------------------------------------------------------------------------------------------------------------------------
------------------------------------------------------------------------------------------------------------------------------------------------------------------------
Is the handle completed at 40's ? Ask the question to your self
------------------------------------------------------------------------------------------------------------------------------------------------------------------------
What Is A Cup And Handle?
A cup and handle price pattern on charts is a old school pattern (traditional chart patterns) that resembles a cup and handle where the cup is in the shape of a "U" and the handle has a slight downward drift.


ADANI POWER | Short Term ResistanceUpon reaching the short term resistance based on the previous trend pattern, the stock has the potential to go long with as high as 13%.


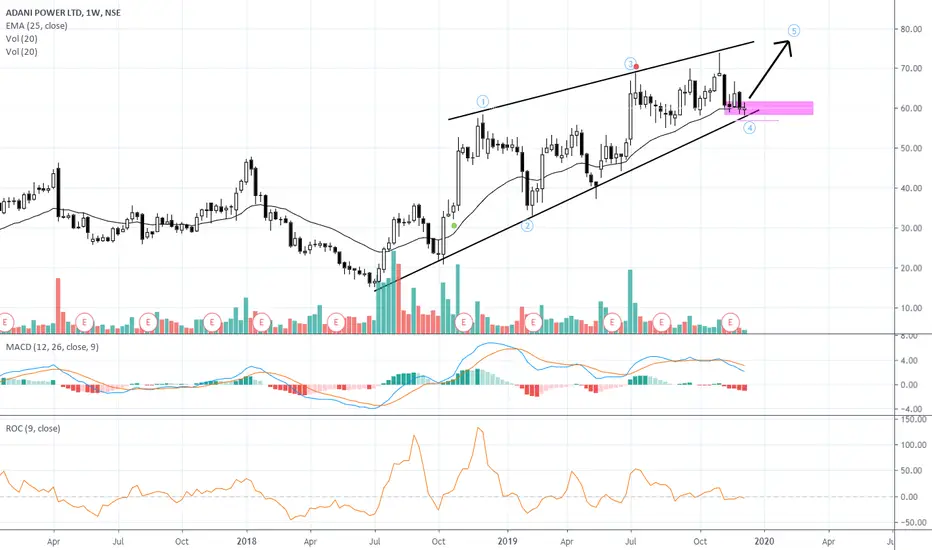
TECHNICAL ANALYSIS ON ADANIPOWERSIMPLE EXAMPLE OF ADANIPOWER HOW TO UNDERSTAND FAKE BREAKOUT IN CHANNEL PATTERN


adani power analysisadani power analysis. if it break 70 then it gives big moves... so now waiting for a breakout..
