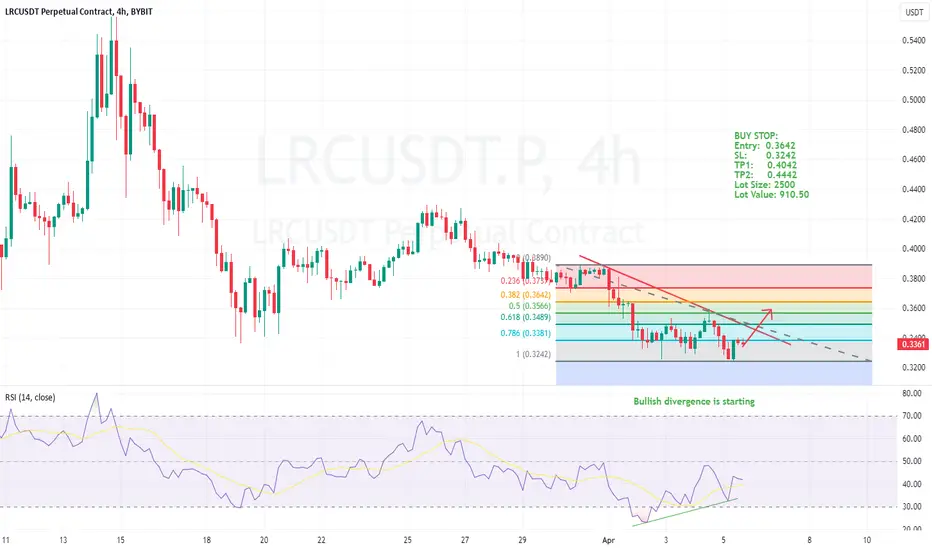
LRC broke the downsloping resistancehi traders,
Expecting an uptrend for altcoins within the next 2 or 3 weeks. LRCUSDT will participate in this uptrend too.
LRCUSDT broke the downsloping resistance. We can see bullish divergences and the double bottom pattern. Everything is suggesting more upside now.
You can buy now or wait for a

LRCUSDT.PHello Trader BINANCE:LRCUSDT.P
rising wedge area pairs lrc, for small resistance it is valid for rejection and breakdown towards the nearest support
take profit 13%
stop loss 3%
Please add a comment and Positive feedback and constructive criticism are important to authors and the community.
D

LRC LOOKS BULLISHThis analysis is an update of the analysis that you can see at the bottom of this page, in the related analysis section
LRC Diametric seems to be complete. By maintaining the green range, it can move towards the targets.
Closing a candle below the invalidation level will violate the analysis
For

Chart 5 of 5: LRCUSDT.P: POSSIBLE TREND REVERSALLRC is probably reversing bearish trend to bullish with Dirvergence evidence.
lrcLoopring is in a bullish pattern in daily time
And it has relatively good support considering the upward trend in the above time
After the failure of the pattern and bullback, I imagine a good bullish line

LRC correction DONE? Possible 40% growth in priceLRC bounce upper supply is that enough? Honestly it's looking very interesting already
Already a possibility of DB on 4hrs TF now if getting that bottom seem like catching a falling knife to you wait 🥴 for the price to cross the neckline region. Honestly it's already due for a ride in price But DY

LRC Next Move: Grab the Bull by the Horns! 🚀 Loopring (LRC) Coin: A Quick Summary
What is it?
Loopring (LRC) is a cryptocurrency token that powers the Loopring protocol. This protocol is designed to help developers build decentralized exchanges (DEXs) that combine the benefits of centralized and decentralized exchanges.
Here's a breakdown:

LRC/USDT Long Projections (Bullish Projections) Based on the continuation of Bullish Momentum,
Looking Good to Me yet, Watching on all Timeframes. Approaching Important Support / Resistance Levels ....
I Personally Think we are likely to push at least to 0.43~ - 0.448 soon (Based on the continuation of Bullish Momentum!) on the shorter Time

LRC/USDT Targets based on Bullish / Bearish Momentum ....Still Bullish on LRC/USDT,
LRC Projections based on Bullish / Bearish momentum.
Still too early to tell just yet, Will be watching closely throughout the day ...
Much more clear line of direction this evening (UK)
Looking at the Daily T/F Starting to look Bullish Will have to wait for confirm

The last bullish chance of LRC in Mid term!Hi.
COINEX:LRCUSDT
😊Today, I want to analyze LRC for you in a WEEKLY time frame so that we can have a Mid-term view of LRC regarding the technical analysis. (Please ✌️respectfully✌️share if you have a different opinion from me or other analysts).
➡️As you can see, LRC is completed this patte

See all ideas
Frequently Asked Questions
The current price of Loopring / TetherUS (LRC) is 0.2449 USDT — it has fallen 5.92% in the past 24 hours. Try placing this info into the context by checking out what coins are also gaining and losing at the moment and seeing LRC price chart.
Loopring / TetherUS (LRC) reached the lowest price of 0.0710 USDT on Jun 29, 2020. View more Loopring / TetherUS dynamics on the price chart.
See the list of crypto losers to find unexpected opportunities.
See the list of crypto losers to find unexpected opportunities.
Crypto markets are famous for their volatility, so one should study all the available stats before adding crypto assets to their portfolio. Very often it's technical analysis that comes in handy. We prepared technical ratings for Loopring / TetherUS (LRC): today its technical analysis shows the sell signal, and according to the 1 week rating LRC shows the sell signal. And you'd better dig deeper and study 1 month rating too — it's sell. Find inspiration in Loopring / TetherUS trading ideas and keep track of what's moving crypto markets with our crypto news feed.
Loopring / TetherUS price has risen by 1.11% over the last week, its month performance shows a 28.03% decrease, and as for the last year, Loopring / TetherUS has decreased by 18.53%. See more dynamics on LRC price chart.
Keep track of coins' changes with our Crypto heatmap.
Keep track of coins' changes with our Crypto heatmap.
Loopring / TetherUS (LRC) reached its highest price on Nov 10, 2021 — it amounted to 3.8500 USDT. Find more insights on the LRC price chart.
See the list of crypto gainers and choose what best fits your strategy.
See the list of crypto gainers and choose what best fits your strategy.
Loopring / TetherUS (LRC) is just as reliable as any other crypto asset — this corner of the world market is highly volatile. Today, for instance, Loopring / TetherUS is estimated as 9.04% volatile. The only thing it means is that you must prepare and examine all available information before making a decision. And if you're not sure about Loopring / TetherUS, you can find more inspiration in our curated watchlists.
You can discuss Loopring / TetherUS (LRC) with other users in our public chats, Minds or in the comments to Ideas.
Loopring / TetherUS highest price ever is 3.8500 USDT, and the maximum drawdown from this value it has ever experienced is 5.32 K%, when Loopring / TetherUS reached 0.0710 USDT. See more of LRC price dynamics on the chart.
The safest choice when buying LRC is to go to a well-known crypto exchange. Some of the popular names are Binance, Coinbase, Kraken. But you'll have to find a reliable broker and create an account first. You can trade LRC right from TradingView charts — just choose a broker and connect to your account.