XAUUSD continues its selling strategyHello dear traders! Let's update the ETHUSDT strategy and discuss this idea!
Overall, the lower highs and lows reinforce the bearish outlook for ETHUSDT, which is currently trading around $3,249, recovering 0.93% today.
With the current general trend and the consolidation from the EMA 34.89 techni

ETHUSDT Trading Strategy Insight ETHUSDT is currently trading around $3249, marking a recovery of 0.93% today. However, there's still a fair amount of risk involved as the downtrend channel and the descending trendline haven't been broken yet.
I'm sticking to a sell strategy for when it hits the $3542 resistance and approaches the

ETH → Am I only one who see it bearish?hello guys...
as you can see the orange area worked like a resistance area and the price couldn't break it yet!
on the other hand, the internal trendline is so close to the price!
also, you can see the price moving below the descending channel!
all of these are bearish reasons! why is the price

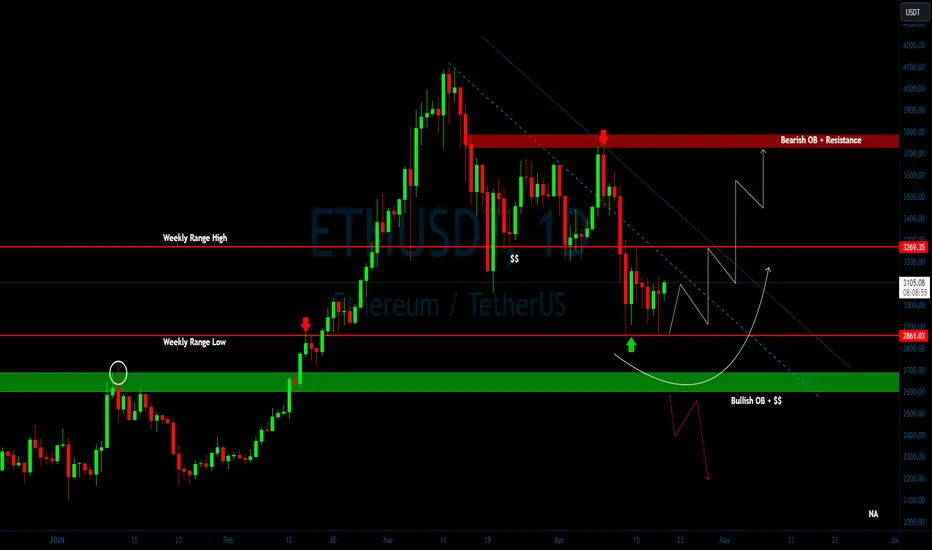
ETH/USDT presenting wonderful scenario? What Next👀💎 Paradisers, let’s explore the captivating movement of #ETHUSDT currently, it is raises probability of bullish continuation from the weekly low range at $2860.84. Although the price is trading above this range, this level remains crucial due to the presence of sound liquidity.
💎 Another intrigui
ETH - Deja Vu🦋Hello TradingView Family / Fellow Traders,
For those who know me, I always enjoy studying previous price action.
📌Today, I want to share an interesting pattern I found on ETH.
Back in Summer 2021, ETH experienced a parabolic bullish impulse (depicted in blue), followed by a correction (shown in p

Ethereum’s Technical Analysis: A Bearish OutlookEthereum’s Technical Analysis: A Bearish Outlook
Ethereum has recently broken out from a strong support zone at 3180, and Ethereum’s price trajectory has taken a bearish turn.
We can observe a bearish wedge pattern on the 60-minute chart, which is often indicative of a continuation of the downwar

ETH buy setupDue to the slowing of the drop slope, and a bullish CH on the chart and the creation of liquidity pools at the top of the chart, as well as the presence of IFC movements, it is expected that if the green range is maintained, ETH will move towards the targets.
The targets are clear on the chart.
Cl

ETHUSDT SHORTThis is just simple trading idea draw into chart using labels and lines. Please use it as educational purpose and you are free to modify any

📊#ETH breaks out of descending triangle📈🧠From a graphical structure point of view, we have formed a descending triangle. The current price has broken through the upper edge of the triangle, which means that we will continue to rise. If we successfully break through the inflection point, then we will have a high probability of sweeping the

ETH: no need to overcomplicateMost of the idea is on the chart:
There is a big range with midrange that acted as resistance after the initial range high was set.
Now we are chopping between D1 EMA 100 and H4 EMA 200, which coincides with the previous range low.
Reclaim H4 EMA and we can long into the next orderblock.
Lose rec

See all ideas
Frequently Asked Questions
Ethereum / TetherUS (ETH) reached the lowest price of 81.79 USDT on Dec 15, 2018.
See the list of crypto losers to find unexpected opportunities.
See the list of crypto losers to find unexpected opportunities.
Crypto markets are famous for their volatility, so one should study all the available stats before adding crypto assets to their portfolio. Very often it's technical analysis that comes in handy. We prepared technical ratings for Ethereum / TetherUS (ETH): today its technical analysis shows the sell signal, and according to the 1 week rating ETH shows the buy signal. And you'd better dig deeper and study 1 month rating too — it's buy. Find inspiration in Ethereum / TetherUS trading ideas and keep track of what's moving crypto markets with our crypto news feed.
Ethereum / TetherUS price has risen by 1.89% over the last week, its month performance shows a 11.05% decrease, and as for the last year, Ethereum / TetherUS has increased by 63.16%.
Keep track of coins' changes with our Crypto heatmap.
Keep track of coins' changes with our Crypto heatmap.
Ethereum / TetherUS (ETH) reached its highest price on Nov 10, 2021 — it amounted to 4868.00 USDT.
See the list of crypto gainers and choose what best fits your strategy.
See the list of crypto gainers and choose what best fits your strategy.
Ethereum / TetherUS (ETH) is just as reliable as any other crypto asset — this corner of the world market is highly volatile. Today, for instance, Ethereum / TetherUS is estimated as 2.35% volatile. The only thing it means is that you must prepare and examine all available information before making a decision. And if you're not sure about Ethereum / TetherUS, you can find more inspiration in our curated watchlists.
You can discuss Ethereum / TetherUS (ETH) with other users in our public chats, Minds or in the comments to Ideas.
Ethereum / TetherUS highest price ever is 4868.00 USDT, and the maximum drawdown from this value it has ever experienced is 5.85 K%, when Ethereum / TetherUS reached 81.79 USDT.
The safest choice when buying ETH is to go to a well-known crypto exchange. Some of the popular names are Binance, Coinbase, Kraken. But you'll have to find a reliable broker and create an account first. You can trade ETH right from TradingView charts — just choose a broker and connect to your account.