Hi All,
The second idea being shared regarding OCN.
Here is the link to the first.

You will notice the idea was generally tracking well until... you guessed it, BTC decided to go for a run and leave ALTS behind. Our MA's had crossed and OCN assumed an upward trajectory until the 8th of April, where bitcoin spread its wings.
The above should be common knowledge by now, and many ALTS have taken a substantial hit since. Now, back to OCN!
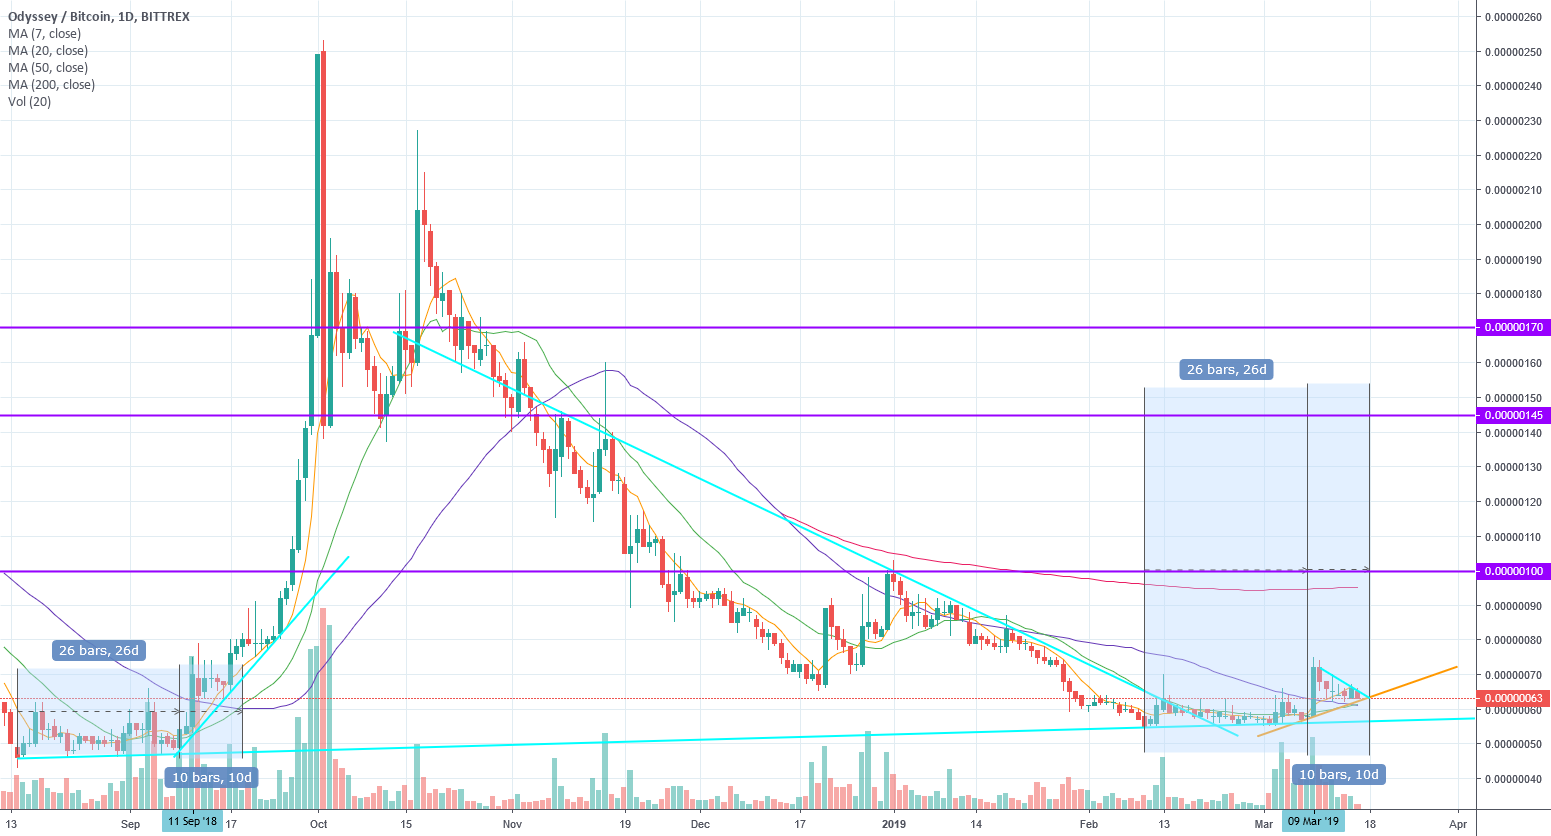
DESCENDING WEDGE Reversal Pattern;
We clearly have a descending wedge which has been in play since October last year. We have practically reached historical Lows (18 satoshis, current day low is 18.94) and the wedge is now due to give a signal within the next 14 days. This is generally a reliable reversal pattern however it is not unfathomable that BTC continues to climb in the coming week and brand new lows are created. The risk to reward ratio to short is simply not worth it, whereas the upside for a Long trade is immense. In short we have a bullish disposition with the Descending Wedge Reversal Pattern.
BOLLINGER BANDS;
For the first time since our major trend reversal in OCT last year, the Volatility range is able to accommodate a breakout from the descending wedge. The upper half of the BB bands are now sitting above the upper descending wedge line and the 20 day MA has also crossed the wedge line which I will touch on more below in the Moving Averages section. The upper BB bands are also crossing into Ichimoku territory. Although trending downwards and just starting to contract, the over all analysis would suggest a bullish disposition with the BB's.
RSI;
New historical low at 13.97. Unprecedented in OCN's trading history. We are in severely oversold Territory. Very bullish disposition on RSI.
MACD & Histogram;
Over all trend is very weak at the moment as per Histogram and has been for some time. MACD should be crossing into positive territory on next cycle. We would want to see a strong accompanying histogram upward trend with the break out of the descending wedge to consider this to be a supporting indicator. At this stage I would say the indicators disposition is largely neutral, albeit respecting the underlying upward trend and suggestive upward move in next cycle.
MA's;
Interestingly 200, 50 and 20 day MA's have all crossed the upper descending wedge line. The only remaining average is the 7 day which is also looking very close to crossing. This is a unique scenario which would suggest our descent is in fact reversing or greatly slowing at the very least. With the averages within the channel, you could almost interpret this as price averages and pattern all in agreeance with each other. The fact the averages have exited the pattern tell us they are not falling at the same pace as the pattern or price anymore, meaning a balancing out is now occurring. In short current downward pressure is still having an effect, but this is greatly diminishing. I would expect the 7 day to cross within the next 2 weeks to follow the other MA's and have a bullish disposition.
ICHIMOKU Clouds;
We are witnessing a contraction currently which is able to accommodate an upward motion. At this stage am still largely neutral on this indicator, however we do have the positives already mention with the MA's and BB's having crossed into this territory. Any price trajectory piercing into the cloud will be considered a highly bullish signal.
SUMMARY & CONCLUSION;
We are guaranteed a signal within the next 2 weeks. It is not impossible that OCN declines further during this time but I cant see this breaking below the descending wedge, giving us a possible lower low of 15 satoshis. Should BTC have another substantial jump I can see this 15 satoshi range being tested but I believe it is unlikely. The above indicators are all largely bullish and coupled with an expected correction of BTC in July we should see positive action with OCN. A safe trade option could be to wait for a days confirmation above the descending wedge trend line prior to entering a trade.
Possible Initial targets are all fibs based.
T1 - 7.5 X @ 131.52 Sats
T2 - 10 X @ 201.74 Sats
T3 - 12.5 @ 258.50 Sats.
I believe its possible for a test of 500 sats if OCN manages to hit 50% fib retracement. Managing this trade would be incredibly important to maximize profit potential.
Confirmations;
Upward break of wedge.
Piercing of Ichimoku.
Crossing of 7 day MA.
MACD crossing into positive value.
Histogram displaying strong upward trend.
Accompanying volume. (ON VOLUME, this chart is from Huobi which i use for historicals, Huobi is not the primary OCN market in volume.)
Invalidations;
Downward break of wedge.
I know a simple invalidation, but we simply do not have much space to deal with anymore when looking downwards. If it breaks down we would do an entirely new analysis.
Thanks guys,
Traders-Corner
***
Any trading advice provided has been prepared without taking into account your objectives, financial situation or needs. Before acting on the information provided you should consider the appropriateness of the information, having regard to your objectives, financial situation and needs. You should seek professional personal financial advice before making any financial or investment decisions.
All investment and trade decisions, no matter how well investigated, involve risk.
***
The second idea being shared regarding OCN.
Here is the link to the first.
You will notice the idea was generally tracking well until... you guessed it, BTC decided to go for a run and leave ALTS behind. Our MA's had crossed and OCN assumed an upward trajectory until the 8th of April, where bitcoin spread its wings.
The above should be common knowledge by now, and many ALTS have taken a substantial hit since. Now, back to OCN!
DESCENDING WEDGE Reversal Pattern;
We clearly have a descending wedge which has been in play since October last year. We have practically reached historical Lows (18 satoshis, current day low is 18.94) and the wedge is now due to give a signal within the next 14 days. This is generally a reliable reversal pattern however it is not unfathomable that BTC continues to climb in the coming week and brand new lows are created. The risk to reward ratio to short is simply not worth it, whereas the upside for a Long trade is immense. In short we have a bullish disposition with the Descending Wedge Reversal Pattern.
BOLLINGER BANDS;
RSI;
New historical low at 13.97. Unprecedented in OCN's trading history. We are in severely oversold Territory. Very bullish disposition on RSI.
MACD & Histogram;
Over all trend is very weak at the moment as per Histogram and has been for some time. MACD should be crossing into positive territory on next cycle. We would want to see a strong accompanying histogram upward trend with the break out of the descending wedge to consider this to be a supporting indicator. At this stage I would say the indicators disposition is largely neutral, albeit respecting the underlying upward trend and suggestive upward move in next cycle.
MA's;
ICHIMOKU Clouds;
We are witnessing a contraction currently which is able to accommodate an upward motion. At this stage am still largely neutral on this indicator, however we do have the positives already mention with the MA's and BB's having crossed into this territory. Any price trajectory piercing into the cloud will be considered a highly bullish signal.
SUMMARY & CONCLUSION;
We are guaranteed a signal within the next 2 weeks. It is not impossible that OCN declines further during this time but I cant see this breaking below the descending wedge, giving us a possible lower low of 15 satoshis. Should BTC have another substantial jump I can see this 15 satoshi range being tested but I believe it is unlikely. The above indicators are all largely bullish and coupled with an expected correction of BTC in July we should see positive action with OCN. A safe trade option could be to wait for a days confirmation above the descending wedge trend line prior to entering a trade.
Possible Initial targets are all fibs based.
T1 - 7.5 X @ 131.52 Sats
T2 - 10 X @ 201.74 Sats
T3 - 12.5 @ 258.50 Sats.
I believe its possible for a test of 500 sats if OCN manages to hit 50% fib retracement. Managing this trade would be incredibly important to maximize profit potential.
Confirmations;
Upward break of wedge.
Piercing of Ichimoku.
Crossing of 7 day MA.
MACD crossing into positive value.
Histogram displaying strong upward trend.
Accompanying volume. (ON VOLUME, this chart is from Huobi which i use for historicals, Huobi is not the primary OCN market in volume.)
Invalidations;
Downward break of wedge.
I know a simple invalidation, but we simply do not have much space to deal with anymore when looking downwards. If it breaks down we would do an entirely new analysis.
Thanks guys,
Traders-Corner
***
Any trading advice provided has been prepared without taking into account your objectives, financial situation or needs. Before acting on the information provided you should consider the appropriateness of the information, having regard to your objectives, financial situation and needs. You should seek professional personal financial advice before making any financial or investment decisions.
All investment and trade decisions, no matter how well investigated, involve risk.
***
Some positive signs, we seems to be crossing RSI resistance, MACD is turning to a bullish phase, and most importantly we seem to have broken upward out of the descending channel.
We do still need a candle stick close above to confirm this. We should get confirmation in the next 2 hours and 20 minutes.
Certainly interesting considering most alts are still bound to BTC at this. This one could break out sooner than some. Lets keep an eye on this.