


GOLD 4H CHART ROUTE MAP UPDATEHey Everyone,
Once again following on from yesterdays update, this 4 chart is also playing out perfectly. After completing both our Bullish 3343 and bearish 3282 targets; we stated price will play tennis between both levels. We also stated that we will look for ema5 cross and lock on either level t

/
The best trades require research, then commitment.
$0 forever, no credit card needed
Photo: Jimmy Chin ©
Where the world does markets
Join 100 million traders and investors taking the future into their own hands.

SOL Analysis Deep Dive: Identifying Optimal Entry and Exit ZonesYesterday, SOL gave a sharp downside shakeout, dropping from the weekly open at $147.98 (perfectly retested) down to the 0.5 Fib retracement of the swing at $140.25. Here’s a structured breakdown of the key levels, trade setups, and R:R profiles for both longs and shorts:
🔑 Key Levels & Confluence

ADA/USDT: Is ADA Preparing for Its Next Rally?(READ THE CAPTION)By analyzing the #Cardano (ADA) chart on the 3-day timeframe, we can see that over the past few months, the price surged from $0.33 to $1.32, delivering a gain of over 300%. After reaching its highest level in 3 years, it faced selling pressure and corrected down to $0.50.
Currently, Cardano is tra

Bitcoin - Repeating History: 100k Next Target?Bitcoin is continuing to move with clean structure, driven by demand imbalances and breakout continuation setups. After the initial breakout from the mid-April range, price moved in a highly technical fashion, consolidating, breaking out, forming a fair value gap, and then retesting it before contin

TradingView Live Show: Charting Volatility with TradeStationJoin us for an insightful TradingView live stream with David Russell, Head of Global Market Strategy, as we dive into the impact of tariffs, market volatility, and key macroeconomic developments shaping today's trading environment.
Oh, and don't forget, TradeStation is sharing ideas here: www.tra

Can non-agricultural data break the deadlock of shocks!Let's sort out the news that have affected the trend of gold in the past two days:
On Tuesday (April 29), gold suddenly began to fall sharply in the Asian market, and the current gold price is around $3,316. Gold prices weakened during the Asian trading session on Tuesday, replicating the trend o

Gold-Silver Ratio: Silver’s Lag and Historical DivergencesThe gold-silver ratio - the number of silver ounces equals in value to one ounce of gold – has surged recently as gold prices rally while silver underperforms. Gold, a traditional safe-haven, has climbed to record highs amid economic uncertainty, whereas silver, which is partly an industrial commodi

$SPY Bullish and Bearish TA signals, but leaning BullishShowing multiple time frames with different TA patterns--some harmonizing, while some are conflicting. When I put it all together the sum for me is slightly bullish.

EURUSD -Broke and Retested Right ShoulderEU - Is providing a great entry. Its sitting on a 4 hour ob. price has been sitting for 3 years in a consolidation phase. looks like this year we are looking to be in a bullish phase. price is sitting on a nice solid support. I will be looking to enter a buy today and hold to the next resistance are

Signs of a possible topBoth spy and vix reached a possible ending target today. We'll see what it looks like tomorrow but right now my feeling is either we topped or there will be one more final squeeze to 5600 tomorrow.

See all editors' picks ideas
Dual-Phase Trend Regime Oscillator (Zeiierman)█ Overview
Trend Regime: Dual-Phase Oscillator (Zeiierman) is a volatility-sensitive trend classification tool that dynamically switches between two oscillators, one optimized for low volatility, the other for high volatility.
By analyzing standard deviation-based volatility states and applying

Nasan Risk Score & Postion Size Estimator** THE RISK SCORE AND POSITION SIZE WILL ONLY BE CALCUTAED ON DIALY TIMEFRAME NOT IN OTHER TIMEFRAMES.
The typically accepted generic rule for risk management is not to risk more than 1% - 2 % of the capital in any given trade. It has its own basis however it does not take into account the stocks

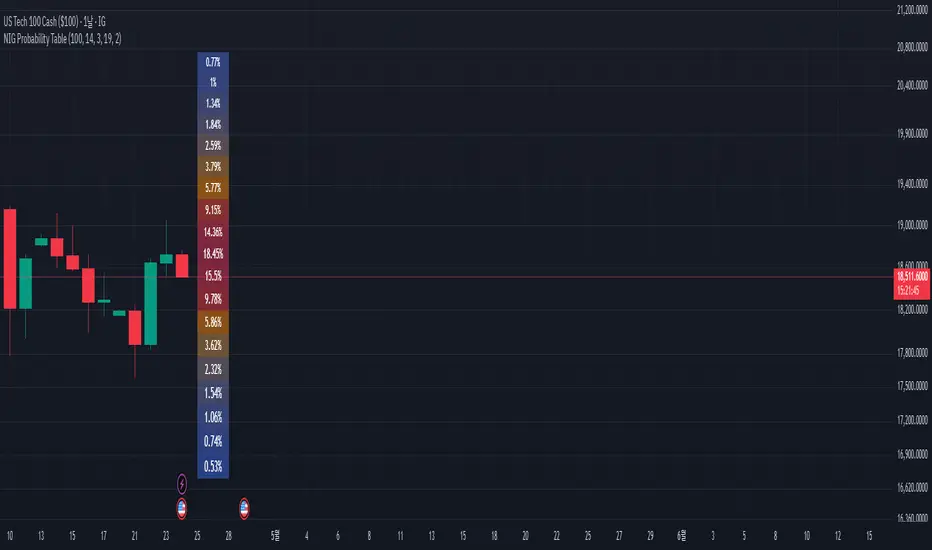
NIG Probability TableNormal-Inverse Gaussian Probability Table
This indicator implements the Normal-Inverse Gaussian (NIG) distribution to estimate the likelihood of future price based on recent market behavior.
📊 Key Features:
- Estimates the parameters (α: tail heaviness, β: skewness, δ: scale, μ: location)
of th
Log-Normal Price ForecastLog-Normal Price Forecast
This Pine Script creates a log-normal forecast model of future price movements on a TradingView chart, based on historical log returns. It plots expected price trajectories and bands representing different levels of statistical deviation.
Parameters
Model Length –

Market Sessions & Viewer Panel [By MUQWISHI]▋ INTRODUCTION :
The “Market Sessions & Viewer Panel” is a clean and intuitive visual indicator tool that highlights up to four trading sessions directly on the chart. Each session is fully customizable with its name, session time, and color. It also generates a panel that provides a quick-glance

Elastic Volume-Weighted Student-T TensionOverview
The Elastic Volume-Weighted Student-T Tension Bands indicator dynamically adapts to market conditions using an advanced statistical model based on the Student-T distribution. Unlike traditional Bollinger Bands or Keltner Channels, this indicator leverages elastic volume-weighted averaging

Dynamic RSI Regression Bands (Zeiierman)█ Overview
The Dynamic RSI Regression Bands (Zeiierman) is a regression channel tool that dynamically resets based on RSI overbought and oversold conditions. It adapts to trend shifts in real time, creating a highly responsive regression framework that visualizes market sentiment and directional

The Mayan CalendarThis indicator displays the current date in the Mayan Calendar, based on real-time UTC time. It calculates and presents:
🌀 Long Count (Baktun.Katun.Tun.Uinal.Kin) – A linear count of days since the Mayan epoch (August 11, 3114 BCE).
🔮 Tzolk'in Date – A 260-day sacred cycle combining a number (1–

Machine Learning RSI ║ BullVisionOverview:
Introducing the Machine Learning RSI with KNN Adaptation – a cutting-edge momentum indicator that blends the classic Relative Strength Index (RSI) with machine learning principles. By leveraging K-Nearest Neighbors (KNN), this indicator aims at identifying historical patterns that resembl

Half Causal EstimatorOverview
The Half Causal Estimator is a specialized filtering method that provides responsive averages of market variables (volume, true range, or price change) with significantly reduced time delay compared to traditional moving averages. It employs a hybrid approach that leverages both historica

See all indicators and strategies
News didn't load
Looks like that didn't go very well. Let's try again.
Community trends
Netflix Skyrockets After Q1 Revenue Surge: What’s Next?📺 NASDAQ:NFLX has recently exhibited a strong bullish trend, supported by both technical breakout structure and positive fundamental developments. After an extended rally from the March lows, the stock managed to break above a key resistance zone between $1,080 and $1,100, it has now been decisive

DUOL - Short until it finds a bottomDUOL earnings ahead, I bet this gonna below 300 post earnings.
AI gonna make this obsolete
AI adaption gonna keep them afloat but can't be a substitute for AI.
Technically this is at right place for the short entry.
Target 1 - 260
Target 2 - 220
Target 3 - 160 over the time

Palantir has a 7 peg ratio, it was cheap at 2. now what?palantir stock is trading at 7x its growth rate in pe, over 200 pe.
Warren Buffett and Peter Lynch would hate this valuation, even though the business is great.
Id be a buyer at 33, roughly where the 200 week or 1000 day moving average is, but thats because I want bargain prices and growth stoc

NFLX Institutional Momentum Anchored in Multi-Decade ChannelNetflix (NFLX) has maintained a structurally intact long-term bullish momentum, consistently trading within a well-defined ascending channel dating back to the early 2000s. Price action has respected dynamic support and resistance levels within the channel, establishing a sequence of higher highs an

MSTR: "Digital Gold" My A** – It's Just Bitcoin with Management Let's call it what it is: a glorified Bitcoin ETF with Michael Saylor as the mascot.
And right now? It's the Titanic with laser eyes.
🚨 Price action looks like a failed breakout.
RSI is rolling over.
Volume on the last bounce? Weak.
And guess what: BTC can go sideways for 2 months and MSTR will sti

TSLA SHORT FROM RESISTANCE
TSLA SIGNAL
Trade Direction: short
Entry Level: 286.64
Target Level: 210.88
Stop Loss: 337.30
RISK PROFILE
Risk level: medium
Suggested risk: 1%
Timeframe: 1D
Disclosure: I am part of Trade Nation's Influencer program and receive a monthly fee for using their TradingView charts in my analysis.

NVDA: Should I Pull The Trigger ?Stock analysis coming this week from various sources saying "Time to Pull The Trigger on NVDA" .. Is it ?
Let's take a quick look ..
- NVDA has recently formed the famous VCP (Volatility Contraction Pattern) - a good sign for a possible breakout soon
- but the VCP is forming below the 50SMA (blu

BullflagFrom what I can see, a bull flag is forming. If it breaks out above, I see 340/360 as a possible target, which is also 50% of the decline from the all-time high.

Azul Brazilian Airlines S.A Stock on inverse head and shoulders pattern
Target price upto 1 $ on Chart
Buy it now 🔥

AMAZON I Technical Forecast Welcome back! Let me know your thoughts in the comments!
** Amazon Analysis - Listen to video!
We recommend that you keep this pair on your watchlist and enter when the entry criteria of your strategy is met.
Please support this idea with a LIKE and COMMENT if you find it useful and Click "Follow

See all stocks ideas
Today
BRK.ABerkshire Hathaway Inc.
Actual
7,078.29
USD
Estimate
7,076.90
USD
May 5
HSICHenry Schein, Inc.
Actual
—
Estimate
1.11
USD
May 5
LLoews Corporation
Actual
—
Estimate
—
May 5
ZBHZimmer Biomet Holdings, Inc.
Actual
—
Estimate
1.77
USD
May 5
AXSMAxsome Therapeutics, Inc.
Actual
—
Estimate
−1.35
USD
May 5
BCRXBioCryst Pharmaceuticals, Inc.
Actual
—
Estimate
−0.08
USD
May 5
OCULOcular Therapeutix, Inc.
Actual
—
Estimate
−0.29
USD
May 5
CMICummins Inc.
Actual
—
Estimate
4.91
USD
See more events
Community trends
BITCOIN Trending Higher - Will Buyers Push Toward $104,550?COINBASE:BTCUSD has broken above a key resistance zone and is now pulling back for a potential retest. This area previously acted as resistance and may now serve as support, aligning with a potential bullish continuation.
If buyers confirm support at this level, the price is likely to move upward

SOL Analysis Deep Dive: Identifying Optimal Entry and Exit ZonesYesterday, SOL gave a sharp downside shakeout, dropping from the weekly open at $147.98 (perfectly retested) down to the 0.5 Fib retracement of the swing at $140.25. Here’s a structured breakdown of the key levels, trade setups, and R:R profiles for both longs and shorts:
🔑 Key Levels & Confluence
BTC - Golden Pocket & Strong FVG Resistance for a Short SetupThe current 15-minute chart of BTCUSDT reveals a textbook bearish setup forming as price retraces into a well-defined supply zone. This analysis focuses on structural breakdowns, liquidity engineering, and key Fibonacci confluences that may lead to a short-term reversal within intraday price action.

MAY Altcoin request: Welcome to May From Recovery to OpportunityHi Everyone,
The storm of April has passed and with it, the weight of uncertainty that gripped global markets. As we enter May, the charts are beginning to flash green, sentiment is cautiously shifting, and risk appetite is gradually returning to the crypto space.
This isn’t just a relief rally—

Bitcoin - All time highs will come next!Bitcoin - CRYPTO:BTCUSD - prepares a significant move:
(click chart above to see the in depth analysis👆🏻)
Over the past couple of months, we basically only saw sideways price action on Bitcoin. However, this does not mean, that Bitcoin is now slowing down; actually the opposite is true and Bit

$100K Bitcoin Within Days » Top Altcoins Choice —Your Pick (S5)Bitcoin is now bullish confirmed with a break above $97,000. Today Bitcoin trades at the highest price since late February 2025, and it is set to continue growing and growing aiming next at a break and challenge of 100K.
As soon as 100K is conquered, the Altcoins will go wild.
Which pair is your f

Bitcoin - Repeating History: 100k Next Target?Bitcoin is continuing to move with clean structure, driven by demand imbalances and breakout continuation setups. After the initial breakout from the mid-April range, price moved in a highly technical fashion, consolidating, breaking out, forming a fair value gap, and then retesting it before contin
Bitcoin may rebound from seller zone and start to declineHello traders, I want share with you my opinion about Bitcoin. In the past, the price had been consolidating within a broad range, repeatedly rejecting support and resistance zones. The buyer zone between 79100 - 80300 provided a strong base, and from there, BTC began to grow, forming a bullish stru

Bitcoin Range-Bound in Heavy Resistance – CME Gap Still Open!Bitcoin ( BINANCE:BTCUSDT ), like Gold , has been moving in a Range for the past 5-6 days and is currently in a Heavy Resistance zone($95,950-$88,500) , as it has been in the past few days .
In terms of Elliott Wave theory , Bitcoin appears to be completing a main wave 4 . The main wave

Bitcoin BTC Has Started CorrectionHello, Skyrexians!
Hope we understood what is going to happen with the Bitcoin dominance, if briefly we are waiting for correction and this dominance dump will likely happen on BINANCE:BTCUSDT dump.
Let's take a look at the impulse which has been started at $75k, it looks like this impulse has b

See all crypto ideas
GOLD ROUTE MAP UPDATEHey Everyone,
Great finish to the week, after completing both our Bullish and Bearish target yesterday, we then finished off with our retracement range gaps.
We also stated that we will look for a cross and lock below this level to open the swing range or failure to lock, will see support and boun

GOLD → Correction before NFP. What are the chances of a decline?FX:XAUUSD strengthens amid dollar correction. The market is correcting ahead of NonFarm Payrolls, trying to accumulate potential before high volatility.
Gold recovers ahead of US employment report
On Friday, gold rebounded from a two-week low, recouping some of its losses ahead of the release

Gold Intraday Trading Plan 5/3/2025Gold behaved just as I predicted but a bit lagged. Instead of going straight to 3228, it went to 3270 first and went up to 3370 and then dropped to 3200. This behavior indicates the further drop in the coming week.
Although overall trend is bullish, I don't think the correction is over yet. I am ex

Hellena | GOLD (4H): LONG to resistance area of 3400.Colleagues, I've redrawn the waves a bit, because it looks like the correction should be over.
I believe that the upward movement will resume soon.
I expect two variants of events:
1) the price will reach the support area 3162, form wave “4” and after that we will see an upward movement - this is a

Gold can correct to support level and then continue to move upHello traders, I want share with you my opinion about Gold. After studying this chart, we can track the progression of Gold's price action from strong bullish momentum to its current consolidation. Initially, the market trended confidently inside an upward channel, with steady growth supported by th

Gold Analysis: China - U.S Tariffs Talks and NFP ImpactGold Analysis: China - U.S Tariffs Talks and NFP Impact
Earlier today, China's Ministry of Commerce said it signaled a possible easing of tensions in the US-China trade war. Talks are still ongoing and this is creating a softer environment for gold to cool off from its strength.
On the other han

Lingrid | GOLD trendline BREAKOUT: Short-Term BEARISH MoveOANDA:XAUUSD made a strong bullish run, but after reaching the top near 3500, the price entered a sideways range and recently broke below the upward trend-line. Now it’s retesting the 3,283–3,300 zone, which may act as resistance. If price fails here, we could see a drop back to the 3,150 support a

GOLD - Price can grow to $3370 resistance levelHi guys, this is my overview for XAUUSD, feel free to check it and write your feedback in comments👊
Recently, price entered to pennant, where it at once bounced from support line and started to grow, but soon corrected.
After this movement, Gold made upward impulse, and broke $3205 level, after wh

May 2nd Trade Journal & Stock Market Analysis** May 2nd Trade Journal & Stock Market Analysis**
EOD accountability report: +821
Sleep: 6 hour, Overall health: :thumbsup:
Another great day in the market, Signals worked decent.
**Daily Trade recap based on VX Algo System**
— 12:50 PM VXAlgo ES X1 Sell Signal :check:
— 1:12 PM VXAlgo E

USOIL What Next? BUY!
My dear followers,
I analysed this chart on USOIL and concluded the following:
The market is trading on 58.35 pivot level.
Bias - Bullish
Technical Indicators: Both Super Trend & Pivot HL indicate a highly probable Bullish continuation.
Target - 60.83
Safe Stop Loss - 57.06
About Used Indica

See all futures ideas
EUR/USD - Channel Breakout (02.05.2025) FX:EURUSD The EUR/USD pair on the M30 timeframe presents a Potential Buying Opportunity due to a recent Formation of a Breakout Pattern. This suggests a shift in momentum towards the upside and a higher likelihood of further advances in the coming hours.
Possible Long Trade:
Entry: Consider Ente

AUDJPY at Key Resistance Level: Will it Drop To 92.850?OANDA:AUDJPY is approaching a key resistance level that has previously acted as a strong barrier, triggering bearish momentum in the past. Given its historical significance, how price reacts here could set the tone for the next move.
If bearish signals emerge, such as rejection wicks, bearish cand

CHFJPY - Sell Setup at Key Resistance LevelOANDA:CHFJPY has reached a significant resistance zone, marked by prior price rejections and strong selling pressure. This level has historically acted as a key supply area, increasing the likelihood of a bearish bounce if sellers regain control.
With the price now testing this resistance, I antic

NZDJPY BULLISH OR BEARISH DETAILED ANALYSIS ??NZDJPY has successfully completed a bullish breakout from the descending channel structure that has been forming since mid-2024. The price action respected the trend boundaries flawlessly, and the breakout above the upper trendline confirms a reversal from the previous downtrend. Now trading around

USDJPY: Time to Recover?!The USDJPY chart formed an inverted cup & handle pattern that has broken its neckline on a daily timeframe, signaling a confirmed Change of Character (CHoCH) and suggesting a potential bullish reversal.
This could lead to a market recovery and a possible move towards the 146.00 level in the near f

HelenP. I Euro may correct to trend line and then rebound upHi folks today I'm prepared for you Gold analytics. After a sharp, impulsive rise, price entered a broad consolidation phase between 1.1575 and 1.1270 levels, creating a horizontal channel where price oscillated for several sessions. This type of structure often serves as a re-accumulation zone duri

NZDCHF: Short-Term Bullish OutlookNZDCHF: Short-Term Bullish Outlook
NZDCHF has formed a bullish Megaphone pattern, which signals a continuation of the existing uptrend when it aligns with the market’s direction.
After a minor pullback, the pair is expected to resume its short-term bullish movement. A breakout above 0.4925 could

Euro can continue to move up inside upward channelHello traders, I want share with you my opinion about Euro. Looking at this chart, we can observe how the price has been moving confidently within the boundaries of a well-formed upward channel. After an extended period of consolidation inside the buyer zone, the market began forming higher lows and

USDCAD: New month, first green dayHello traders and welcome back to my channel, as always, my analysis are not a way to predict the market, but long and short are just a signal regarding the setup I'm looking for the day.
Guessing the direction is not part of my job, entering setups in line with my thesis, that's my job!
A little c

GBPJPY - Crazy Bullish!Hello TradingView Family / Fellow Traders. This is Richard, also known as theSignalyst.
📈GBPJPY has been overall bullish trading within the rising channel marked in blue.
Moreover, it is retesting a strong demand zone marked in green.
🏹 Thus, the highlighted blue circle is a strong area to look

See all forex ideas
| EUR | USD | GBP | JPY | CHF | AUD | CAD | ||
|---|---|---|---|---|---|---|---|---|
| EUR | - | - | - | - | - | - | - | |
| USD | - | - | - | - | - | - | - | |
| GBP | - | - | - | - | - | - | - | |
| JPY | - | - | - | - | - | - | - | |
| CHF | - | - | - | - | - | - | - | |
| AUD | - | - | - | - | - | - | - | |
| CNY | - | - | - | - | - | - | - | |
| CAD | - | - | - | - | - | - | - |
Trade directly on the supercharts through our supported, fully-verified and user-reviewed brokers.


