USOILSPOT trade ideas
XAUAUDThe Chart is printing HH and HL with no divergence so the trend is Bullish
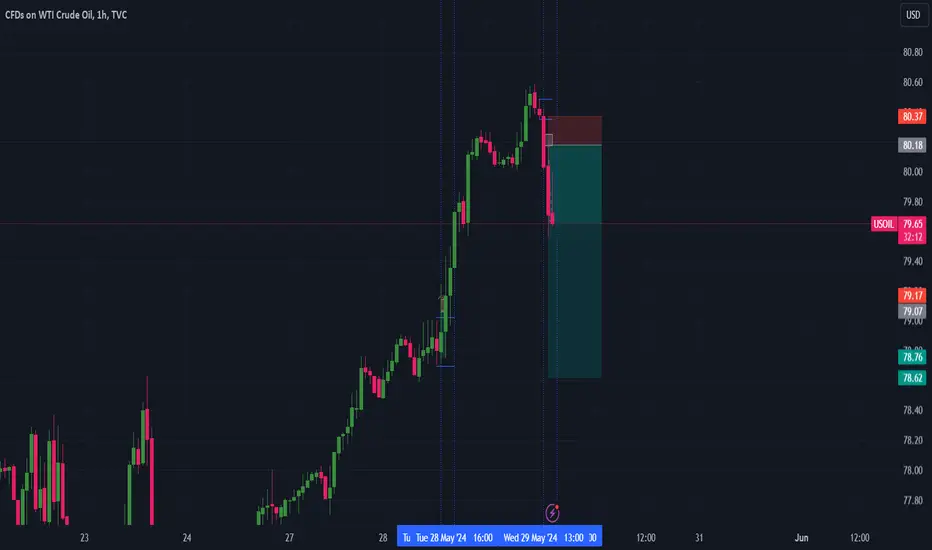
The Entry Point will be 80.66 and the stop Loss will be 78.84

Can Oil soar on June 2 OPEC+ cut hopes? Can Oil soar on June 2 OPEC+ cut hopes?
WTI crude futures and Brent continue to recover from three-month lows. The rebound is potentially driven by expectations that OPEC+ will extend its output cuts of 2.2 million barrels per day into the second half of the year during its June 2 meeting.
Additional support for crude prices came from the start of the U.S. summer driving season and a weaker dollar.
Further data on the demand side will come from upcoming U.S. PCE to gauge the Federal Reserve's future monetary policy. A softer-than-expected reading on the PCE could increase the possibility of interest rate cuts, and potentially enhance the demand for energy.
Deutsche Bank has maintained its Brent forecast at $83 per barrel for the second quarter and $88 for the second half of the year, assuming OPEC+ will sustain its current production policy on Sunday.
Should prices move above the $80 level, WTI could test the 50-day moving average just above $81.1. The RSI suggests there is still room for prices to rise before reaching the overbought zone. Conversely, if prices fall below the $78 range, they might stabilize around the $76 mark.

Oil long soonI love this Oil long chance here, Aiming for 87-90 area or anywhere in the rectangle. Conservative traders can wait for a break of the channel to get long. I will do the same.

Oil BoilAll ideas are strictly my interpretation of price action. I am not a professional trader nor is this
professional advice.
I will continually update all trades.


WTI or USOhello everyone...
the price reach the main resistance area as well reached the resistance downtrend line...price will likely pull back to support area... with today news of crude oil show high number of oil inventories. based on fundamental and technical, we should see some pull back for now...
good luck

WTI (Crude) Price Action on 15m TimeframeThere is currently seeing bullish price action on the 15m timeframe which appears to be a pullback/retracement on the 4h timeframe which is now displaying bearish price action.
This appears to be preparation of lower timeframe re-alignment of the higher timeframe price action. The expectation is that price will "tap-in" at the 78.36 price point where there is identified bearish orderflow.
Price is currently in Premium so we are only interested in shorts at this time. We also are using internal range liquidity (FVGs, Trandline Liquidity) below the current support as confluence for downward price movement in the coming hours.

USoil will further push Down-side After Testing TrendlineHello Traders
In This Chart XTIUSD HOURLY Forex Forecast By FOREX PLANET
today XTIUSD analysis 👆
🟢This Chart includes_ (XTIUSD market update)
🟢What is The Next Opportunity on XTIUSD Market
🟢how to Enter to the Valid Entry With Assurance Profit
This CHART is For Trader's that Want to Improve Their Technical Analysis Skills and Their Trading By Understanding How To Analyze The Market Using Multiple Timeframes and Understanding The Bigger Picture on the Charts

USOIL - Short or Buy? Break down or retracement up? Technicals
1. We have been stuck in a range on a higher time frame for quite some time now.
2. On a higher time frame we failed to confirm a break-up from a trendline dating back to March 2022, which was the COVID-19 highs. A failed break-up of this mega trendline is normally a sign of big reversal or retracement. & we did just that ;-) question is, is this a reversal or just a retracement because I see also a trendline from DEC 2023 which we trade just under. IMO we have not fully confirmed that break down.
3. Visible in my chart we see that we are since then on a big down sloping channel which is still respected.
Fundamentals
1. My bias is slightly bearish long term because I think the US economy & other major economies will be in a recession which will give downside pressure on the price of OIL
2. Conflict in the Middle East seems to have not a significant impact as of now on the price of USOIL. Will this change? Till I see major escalation happening I don't see that it will have greater impact than it already has. US also is less energy dependent so therefor geopolitical will impact less.
3. Bullish sign is that OPEC is still holding strong on OIL cuts and China is still strong. Summer season will also give some upside pressure because of demand.
Trade
1. The first trade, which is a buy option, I will take if I see buyers really taking over to push price up
2. The second trade, which is a sell, I will take if we confirm a break and retest of the weekly low.
Great trading all of you
Greetingz,
Simba Trades

USOil short term Bullish and long term Bearish**Monthly Chart**
USOil last monthly candle created a swing high with a Ring high formation which indicates a continuation of the bearish trend as it bounced from a key level at around 87.60. This month the price opened from the low of the previous candle and continues to move lower. The next level is around 70.00 and then 66.60.
**Weekly Chart**
The last weekly candle closed bearish which has created a different opinion on whether USOil price might continue moving lower after breaking the soft support level or bounce from it at around 75.90.
**Daily Chart**
I am seeing short-term bullish to break the equal highs above 80.00 level before continuing the move lower. Therefore, my long-term bias is still bearish for USOil.
The plan for this week. I will only react near the low and high of the levels that I marked. Plus I will look for a confirmation candle (some calls it insurance candle).

OIL: DAY 3 SHORTS in the marketHi everyone and welcome to my channel, please don’t forget to support all my work subscribing and liking my post, and for any question leave me a comment, I will be more than happy to help you!
“Trade setups, not movements”
Let’s jump into the Technical Analysis:
WEEKLY TEMPLATE (1hr chart):
Since the previous week, we can see how this market potentially could complete the big template of pump and dump, scenario still possible if setup correctly.
OIL market triggered shorts breakout traders in, typical a signal of potential strong move.
DAILY TEMPLATE (15min chart):
Asia session broke down into the LOW, reversing sharply in London session (pump). Currently this market is not in an interesting level to buy or sell.
THESIS :
Short: considering the weekly pump and dump not completed yet, I can see this market going lower, stopping all the traders long since the last week.
Long: however, day 3 shorts in the market, in the new weekly cycle, can be a good reversal signal, going to stop traders short from Monday.
SETUP :
Short: price pumping up back to the previous HOD, consolidating for 30/45 min and dump (after the news release)
Long: Market dropping down at least into the previous CP, or LOD/LOW, consolidating for a pump (this scenario is mostly likely happing on tomorrow, which is closing range of the week)
Please note that the purpose of my analysis is to help me and you hunting the best trade setup for the day, none of my technical aspects are a way to forecast any directional market movement.
Gianni

WTI OIL Strong rejection on 1D MA200 but be aware of a break-outWTI Oil (USOIL) made yesterday a strong rejection on the 1D MA200 (orange trend-line), which has been essentially the Resistance since the price broke below it on May 01. Having this level as a Resistance for 3 weeks makes it the strongest sell entry candidate, considering also the fact that this is the top of the 1-month Channel Down, thus a new Lower High.
As long as we don't close a 1D candle below the 1D MA200, we will be bearish, targeting 74.00 (-7.75% decline, similar to both previous Bearish Legs of the Channel Down). If we do close a 1D candle above the 1D MA200, we will take the small loss and target 83.00 (the 2.0 Fibonacci extension). The reason for being prepared for a long position as well, is because the 1D MACD formed a Bullish Cross.
-------------------------------------------------------------------------------
** Please LIKE 👍, FOLLOW ✅, SHARE 🙌 and COMMENT ✍ if you enjoy this idea! Also share your ideas and charts in the comments section below! This is best way to keep it relevant, support us, keep the content here free and allow the idea to reach as many people as possible. **
-------------------------------------------------------------------------------
💸💸💸💸💸💸
👇 👇 👇 👇 👇 👇

USOIL PRICE BULLISH SENTIMENT WITH HOPEFUL SIGNS📈USOIL Anylisis
🔍Currently USOIL Finds itself at a crossroads caught between two vitel daily structures. Looking ahead to potential moves here are two scen to watch:
1) Bullish outlook if the market breaks the trend line and seals the deal with a solid close above a hefty resistance line forming a Substantial falling wedge on the dialy chart it might be time to gear up for a bullish ride. Traders could set their sights on a target of at least 78.8500
2) Bearish perspective: on the flip side a Breach of the crucial 76.700 support level could spell trouble for the bulls. This move would signify strong bearish confirmation possibly paving the way for a significant download plunge with a downsides Target of around 79.9500
In essence the fate of USOIL hangs in the balance with traders eagerly awaiting signals of either bullish resurgence 🚀 or Bearish dominace in a head stay tuned for Updates! 📈

Crude Oil Battles to Break Through Key Support ZoneHello There,
Technical Outlook:
Crude oil prices have been locked in a tug-of-war around a critical support area, testing the 76.253 level twice in recent trading sessions. Despite the downward pressure, the commodity appears poised to make a push higher, according to RSI levels.
The 77.082 - 76.253 zone has emerged as a key support area, and a higher low above this range could signal the start of a bullish trend. A potential move higher could see prices stretch up to test supply levels.
If prices can establish a higher low above that zone, it would lay the groundwork for a bullish breakout and a push toward the upside. However, the setup would be invalidated if prices were to fall below the 75.324 red line.
Overall: If the price gains the momentum to hold above the key support zone, it could set the stage for a sustained rally, but a breakdown below 75.324 would likely signal a shift in the overall market sentiment ending the range in the Weekly timeframe.
Fundamental Points:
Oil prices went down because:
There's too much oil being produced and not enough being used
Inflation (prices going up) in the services sector (like healthcare, education, and finance) might stay high for a while
This means interest rates (the cost of borrowing money) might stay high for longer than expected
There's now more oil stored in tanks than expected, which is also causing prices to fall
Happy Trading,
K.

OIL W. LongI expect oil to rise in the next few weeks. On the daily chart we see liquidity (circles) and a very very strong saport at 77.40. I expect oil to start rising from 78.09 or the aforementioned 77.40. At each level I will watch the Order Flow Chart. in case you don't have O.F.CH. so watch the level if the price closes above or below the level it will tell you if the price will continue to the level above or below.
In case the price falls below 77.40 and closes below this level we are looking at lower levels which are shown in the chart.
I wish you lots of rich success and don't forget about money management because it is the only way to make money .-)
Rocket will be very pleased and will motivate me to further public analysis.

USOIL: Multi-Timeframe Analysis | Strong Setup FormingI've been exploring through different markets over the past few days, and one thing that really caught my attention was TVC:USOIL
So, I decided to share my thought process of how I analyze any market from a top-down perspective while using all timeframes to create a bias.
Top-down analysis is always the key element of how I approach any market.
This way of viewing the market has really helped me to remove subjectivity when analyzing a pair.
Instead of relying on my personal view, I can confidently rely on what the market is showing me regarding trend and zones.
Adopting a mechanical perspective has genuinely helped to remove doubt and fear in my overall trading.
Now let's get into the top-down process:
12M:
6M:
3M:
1M:
2W:
1W:
1D:
Feel free to suggest which market you'd like me to cover next!

Oil Prices Dip Amid Rising U.S. Inflation and Steady OPEC DemandOil prices fell early Tuesday following a report that U.S. inflation increased more than anticipated, diminishing prospects for a reduction in U.S. interest rates. Meanwhile, OPEC maintained its positive demand forecast for 2024.
West Texas Intermediate crude for June delivery decreased by $0.47 to $78.65 per barrel, and July Brent crude, the international standard, dropped by $0.46 to $82.90.
The U.S. Bureau of Labor Statistics reported that the producer price index (PPI) for April rose by 0.5% from March, a higher increase than the previous month's 0.3% and surpassing the predicted 0.3%. The core PPI, which excludes food and energy, climbed 0.4%, exceeding both the previous month's 0.2% and the anticipated 0.2%.
This data, indicating that U.S. prices are continuing to rise beyond the Federal Reserve's 2% target, lessens the likelihood of a rate cut from the current 23-year highs before the end of the year. The U.S. consumer price index for April, expected to show a 3.4% annual increase down from 3.5% in March, will be released on Wednesday.
The price already dropped as we mentioned in the previous idea, and still trading at the bearish zone to reach 75.35.
so the bearish trend suggestion will continue as long as trades under 78.78 toward 76.60 and 75.35
the price will move between 80.73 and 75.35 for this week
Pivot line: 78.78
Support lines: 76.60, 75.35, 69.78
Resistance lines: 80.73, 82.24, 83.75
previous idea:

USOIL enjoys relief but has an uneasy path ahead of itWest Texas Intermediate crude oil trades near $79.80 per barrel, which happens to be slightly below the 20-day SMA and the lower bound of the ascending channel. A breakout above the moving average will bolster a bullish case for oil in the short term, especially if the price closes above the 20-day SMA for multiple consecutive days; the same applies to a breakout above the channel’s lower bound. Once the 20-day SMA is broken, $80.44 and $82.25 are important resistance levels to watch out for. However, a rejection at the moving average and channel’s bound will be somewhat concerning, potentially foreshadowing further stagnation around the current price or return of weakness.
Illustration 1.01
Illustration 1.01 displays simple support and resistance levels derived from past peaks and troughs.
Illustration 1.02
The daily MACD of USOIL is shown above. The yellow arrow indicates a bullish crossover between the MACD line and the signal line. However, it is important to emphasize that MACD is still within the bearish area below the midpoint.
Technical conditions
Daily time frame = Bullish
Weekly time frame = Neutral
Monthly time frame = Neutral
Please feel free to express your ideas and thoughts in the comment section.
DISCLAIMER: This analysis is not intended to encourage any buying or selling of any particular securities. Furthermore, it should not be a basis for taking any trade action by an individual investor or any other entity. Therefore, your own due diligence is highly advised before entering a trade.

WTI, back at major order block support -- BOUNCE expectedWTI is currently sitting at below 0.5 FIB level on a weekly data -- a key area where most buyers converge.
$65-70 area has been quite a solid order block support. It has been tested many times and oil keeps bouncing up from this range.
A bounce is expected from current price range. Accumulation has notably started increasing at the present levels.
Spotted at 69.0
TAYOR.
Safeguard capital always.
--------
RELATED NEWS: Reuters
Oil prices settle more than 3% higher after China rate cut
By Stephanie Kelly
NEW YORK, June 13 (Reuters) - Oil prices climbed over 3% on Tuesday on hopes for growing fuel demand after China's central bank lowered a short-term lending rate for the first time in 10 months, boosting crude prices after steep losses the previous session.
The rate cut is aimed at adding momentum to a hesitant post-pandemic recovery in the world's second-largest economy and biggest crude importer.
Brent crude futures settled up $2.45, or 3.4%, to $74.29 a barrel. U.S. West Texas Intermediate (WTI) crude gained $2.30, or 3.4%, at $69.42 a barrel.

US OILWe are starting to see the early signs of seasonal tendencies across all markets. Price took out the 76.84 low (Turtle soup) on which it is acting as a support currently. The consolidation we are currently in will most likely be broken in the next week and we will look for an entry long on the lower TF as well. Target 1 coming in at 82.05, Target 2 at 84.42 and Target 3 at 87.59 More updates to follow

USOIL WTI: Bullish Momentum Ahead? - May 8, 2024Hey traders! 📈 Let's discuss the current outlook for USOIL WTI:
🔍 Technical Insight:
We've observed a compelling development in the WTI market as it recently touched the lowest point within the current uptrend channel, dipping below the golden pocket levels. This move prompts a closer examination of the prevailing market dynamics.
📊 Daily Timeframe Perspective:
Zooming out to the daily timeframe, the overarching trend remains bullish, reflecting the resilience of the oil market. However, it's crucial to note that a consolidation phase appears to be underway. Such periods of sideways movement often precede significant price actions.
🔄 Awaiting Breakout Momentum:
One notable aspect in recent days is the absence of substantial price movements, typically characterized by WTI's propensity for $3 or greater swings. This prolonged consolidation phase suggests that a significant move may be expected in the upcoming days.
💡 Anticipated Market Activity:
Given the historical tendencies of WTI, we anticipate a breakout from this consolidation phase in the near future. Such a move could potentially signal the resumption of bullish momentum or a reversal in the prevailing trend.
📈 Trading Strategy Consideration:
For traders, exercising patience while monitoring price action for signs of breakout momentum is paramount. Deploying appropriate risk management strategies and remaining adaptable to evolving market conditions can help navigate uncertainty.
🔔 Key Takeaway:
As we await clarity on WTI's next directional move, it's essential to stay vigilant and prepared to capitalize on emerging opportunities. Whether it's a continuation of the uptrend or a reversal, flexibility is key to navigating the dynamic oil market.
🛢️ Closing Thoughts:
In conclusion, while the current consolidation phase may signal a temporary lull in market activity, the potential for a significant move looms on the horizon. Keep a watchful eye on price developments and be ready to adjust your trading strategy accordingly.

Fundamental & Technical analysis on USOILMay 20th 2024
Fundamental: Were seeing a up tick in Non-comm Long and Short positions being held. Shorts are increasing at a faster pace. The Net positions is positive and holding steady.
Commercial (Hedgers) short positions is increasing significantly quicker then Longs, Net position is negative and decreasing/holding.
Technical: I'm expecting to see consolidation for the coming week/s between 78-81 with price action making a lower high causing a fake EMA cross over to the upside and setting its self up for more down side.
Entry Criteria: For me to consider a entry i have to keep seeing Short positions increase for both Non-comm and Comm in the coming weeks as well as Non-comm Longs decreasing. Ideally for Price action i want to see USOIL consolidate then make a lower high before its leg down (BLUE), there's the possibility it makes the lower high without consolidating (RED) but I do need to see the 5 EMA cross down the 20 EMA while Momentum is negative and the Stochastic is crossing down 50%
