USDHKD trade ideas

U.S. DOLLAR / HONG KONG DOLLAR (USDHKD) DailyDates in the future with the greatest probability for a price high or price low.
The Djinn Predictive Indicators are simple mathematical equations. Once an equation is given to Siri the algorithm provides the future price swing date. Djinn Indicators work on all charts, for any asset category and in all time frames. Occasionally a Djinn Predictive Indicator will miss its prediction date by one candlestick. If multiple Djinn prediction dates are missed and are plowed through by same color Henikin Ashi candles the asset is being "reset". The "reset" is complete when Henikin Ashi candles are back in sync with Djinn price high or low prediction dates.
One way the Djinn Indicator is used to enter and exit trades:
For best results trade in the direction of the trend.
The Linear Regression channel is used to determine trend direction. The Linear Regression is set at 2 -2 30.
When a green Henikin Ashi candle intersects with the linear regression upper deviation line (green line) and both indicators intersect with a Djinn prediction date a sell is triggered.
When a red Henikin Ashi candle intersects with the linear regression lower deviation line (red line) and both indicators intersect with a Djinn prediction date a buy is triggered.
This trading strategy works on daily, weekly and Monthly Djinn Predictive charts.
This is not trading advice. Trade at your own risk.

U.S. DOLLAR / HONG KONG DOLLAR (USDHKD) WeeklyDates in the future with the greatest probability for a price high or price low.
The Djinn Predictive Indicators are simple mathematical equations. Once an equation is given to Siri the algorithm provides the future price swing date. Djinn Indicators work on all charts, for any asset category and in all time frames. Occasionally a Djinn Predictive Indicator will miss its prediction date by one candlestick. If multiple Djinn prediction dates are missed and are plowed through by same color Henikin Ashi candles the asset is being "reset". The "reset" is complete when Henikin Ashi candles are back in sync with Djinn price high or low prediction dates.
One way the Djinn Indicator is used to enter and exit trades:
For best results trade in the direction of the trend.
The Linear Regression channel is used to determine trend direction. The Linear Regression is set at 2 -2 30.
When a green Henikin Ashi candle intersects with the linear regression upper deviation line (green line) and both indicators intersect with a Djinn prediction date a sell is triggered.
When a red Henikin Ashi candle intersects with the linear regression lower deviation line (red line) and both indicators intersect with a Djinn prediction date a buy is triggered.
This trading strategy works on daily, weekly and Monthly Djinn Predictive charts.
This is not trading advice. Trade at your own risk.

U.S. DOLLAR / HONG KONG DOLLAR (USDHKD) MonthlyDates in the future with the greatest probability for a price high or price low.
The Djinn Predictive Indicators are simple mathematical equations. Once an equation is given to Siri the algorithm provides the future price swing date. Djinn Indicators work on all charts, for any asset category and in all time frames. Occasionally a Djinn Predictive Indicator will miss its prediction date by one candlestick. If multiple Djinn prediction dates are missed and are plowed through by same color Henikin Ashi candles the asset is being "reset". The "reset" is complete when Henikin Ashi candles are back in sync with Djinn price high or low prediction dates.
One way the Djinn Indicator is used to enter and exit trades:
For best results trade in the direction of the trend.
The Linear Regression channel is used to determine trend direction. The Linear Regression is set at 2 -2 30.
When a green Henikin Ashi candle intersects with the linear regression upper deviation line (green line) and both indicators intersect with a Djinn prediction date a sell is triggered.
When a red Henikin Ashi candle intersects with the linear regression lower deviation line (red line) and both indicators intersect with a Djinn prediction date a buy is triggered.
This trading strategy works on daily, weekly and Monthly Djinn Predictive charts.
This is not trading advice. Trade at your own risk.

WAIT WAIT WAIT!!! Looking Juicy from MAJOR SUPPORT...Weekly Major Support since 2009..Pattern forming waiting on reversal for execution
Looking for the next target around the 7.76 Area or the Moonshot of the 7.79 Area


USDHKD Potential Bullish MovementUSDHKD Potential Bullish Movement
we are waiting for a momentum candle close above 7.75520 to buy this one
Reason:
1- Divergence on MACD (in red)
2- Objective Ascending Triangle (in blue)
3- Support Round Number from Daily 7.7500 (in purple)
Three confluences are enough to consider Buying USDHKD, after a break below 7.75520 (in gray)


USD HKD BUY (US DOLLAR - HONG KONG DOLLAR)Hi there. Price is forming a reversal pattern to change its formation. Wait for the price to complete the pattern and watch strong price action for buy.

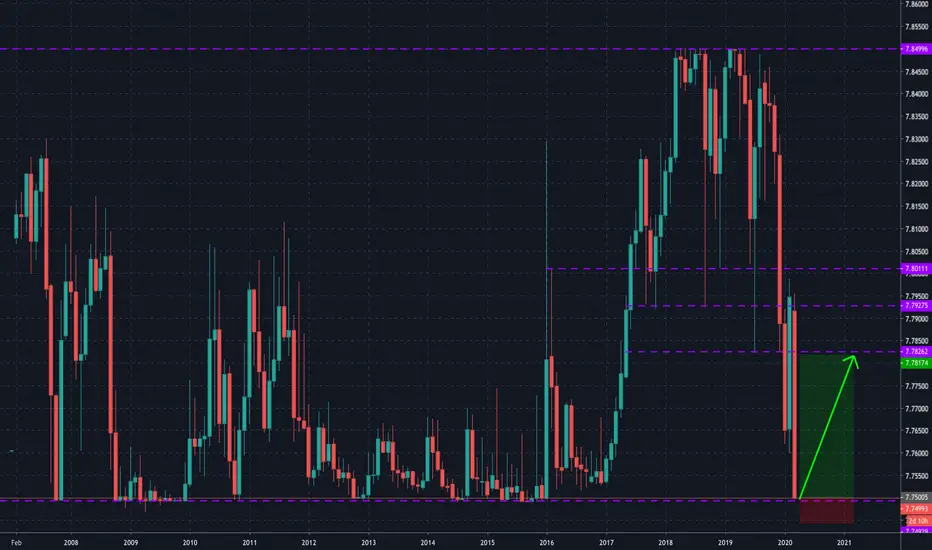

CHART OF THE MONTH : Potential Long. Price is approaching once again strong support levels , price has not been able to break below these levels in past , and considering that history repeats itself we may see strong move upside.
USDHKG has been exceptionally kind to us as we have been able to sell from top in our analysis and now we can see strong long opportunity with small risk...
In these articles we post intraday possible outcomes of pairs based on naked trading setup only .. We do not take into account fundamental news which may move pair significantly in any direction , follow your trading plan .
Follow us for more updates....


USDHKD. buy. just...buy...weekly demand level just sitting there waiting to be bought. look at the volume! take profits at the midline or top...

The US dollar has slipped largely against the Hong Kong dollarThe US dollar has also slipped largely against the Hong Kong dollar, with the buck barely taking back its losses to the Asian currency amid the health crisis. The exchange rate has fallen to record lows as the buck loses its shimmer against the HKD. The Hong Kong dollar’s strength is largely due to the fact that the US central bank has slashed key interest rates to zero. The strengthening also follows the Hong Kong Monetary Authority’s decision last week to cut its base rate by 64 basis points to 0.86%, which is comparatively less aggressive than the Fed’s 100-point cut. And because of the gap, the higher-yielding Hong Kong dollar assets are more attractive for investors. In the past month, traders have been buying the US dollar to buy the Hong Kong dollar, making it among the most profitable carry trade in the realm of the forex market. There’s also higher liquidity for the HK currency, with banks hoarding cash for quarterly regulatory checks.

USDHKD Potential Bullish MovementUSDHKD Potential Bullish Movement
we are waiting for a momentum candle close above 7.760 to buy this one
Reason:
1- Regular Bullish Divergence on MACD (in red)
2- Objective Wedge (in blue)
3- Support / Demand Zone from Daily (in purple)
Three confluences are enough to consider Buying USDHKD, after a break below 7.760 (in gray)

Another potencial trade to start the week. Short at 7.75621 Stop Loss 7.76182 Take Profit 7.75341, for a nice profit of at least 21 pips!

$USDHKD: Sell Stop (Pending Order) below 7.76604$USDHKD: Sell Stop (Pending Order) below 7.76604
TP1= 7.76085
SL = 7.77124

USDHKD - 3 hour ChartHello Amigo’s
I will share my thoughts on the current market situation and any possible targets. You can make your conclusion out of this and make your own decision how to play it!
USDHKD is showing signs of continuation to the downside. We have a indecision candle on the 3 hour chart, EMA’s are acting as resistance. There is big chance that the lower high is set.
If we fail to hold support we will drop probably to 7.76 and further to 7.75.
Guys, my goal is to reach my first 100 followers this month! A like and follow is all I need and its FREE! Thanks so much.

USDHKD INVERSE HEAD AND SHOULDERS PATTERN? ENGLISH MTFAHello traders,
It looks like a double bottom and possibly a head and shoulders in either direction. Really strong resistance that will need to be tested again.
-Live long and profit
zm


Potential rejection soon : Price is faltering near key resistance level , potential short ahead towards retest of ascending trendline ,
Idea will invalidate if price manages to climb above resistance..
Follow us for more updates....
