USDBRL trade ideas


USDBRL awaiting breakout of triangleAwaiting development in USDBRL on this symmetrical triangle formation
Most of the time if a triangle like this happens in a trend, the breakout that follows goes with the trend.
Yet, to me, it is wait and see.
Implications on commodities:
- Breakout higher would be bearish for sugar and coffee (both traded in USD on the ICE)
- Breakout lower would mean advances both in sugar and coffee


BTCBRL X BITUSD - Oportunidades | Arbitrage OpportunitiesPortuguês:
--
A linha azul representa o preço aproximado em BRL da bifinex (dólar x btcusd mais o custo aproximado para enviar dinheiro lá).
A linha vermelha representa o preço real do btcbrl (média entre BITCOINTOYOU e FOXBIT).
Quando o a linha vermelha está abaixo da azul é tempo de pensar em comprar bitcoin no brasil, e quando está acima da azul é tempo de pensar em vender bitcoin lá. Quanto maior a diferença, melhor a oportunidade.
Aceito doações: 1JUqDywAGbuwsdwvwSdBshYXcY45gJgL56
English:
--
The blue line represents the approximate price in BRL of bitfinex (dollar x btcusd plus the approximate cost to send money there).
The red line represents the actual price of btcbrl (average of BITCOINTOYOU and FOXBIT).
When the red line is under the blue is time think to buy btc in Brazil, and when it is above time to think do sell there. The greater the difference, better the opportunity.
Tips accepted: 1JUqDywAGbuwsdwvwSdBshYXcY45gJgL56

Easy to climb up, hard to stay there!See chart and understand, almost same setup as USDZAR.
Good luck!

Brl oversold? Bull div?This is my first post here, trying to see is happening a bull div. Usd is still getting strong but maybe there is some "correction" comming.

Dolar BRRompeu triangulo.
Rompeu candle âncora
só que parou na resistência..vamos ver onde isso vai..


USDBRL - Snapshot on a friend's requestWeekly:
- Ichimoku setup is long term bullish. We still do not have a Kumo overshade and Chikou will stay in open space for long time. Of course at 3,20 and above Price was a bit overbought, got far above from longer term equilibrium levels, so a correction had to start.
- Heikin Ashi signal is counter bearish, the mkt is in a massive pull back phase. To candles marked with ellipse were the weeks, where mkt gave first signals of a consolidation or possible pull back. Those two candles had both upper and lower wicks, both candle bodies were inside body and haDelta/SMA3 crossed down from an extremely high level.
Since then, during the last two weeks the correction is in progress.
- Correction may continue down to Kijun Sen at 2,85 as first main support.
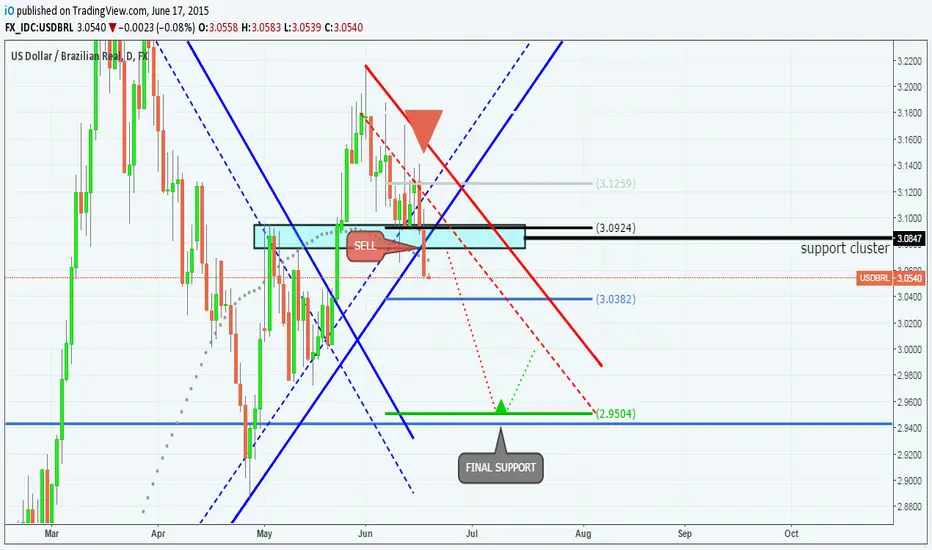
Daily:
- Ichimoku setup turnied from bullish to neutral, with some more bearish bias now -> Price is in the Kumo, Chikou is below Price but way above past Kumo, Tenkan/Kijun is weak bearish. Ichimoku trend followers had to exit long positions when Price broke back below Kijun Sen - buffer, so ard 3,08 offered level on 8-9/April.
Now Price will either start to range trade within the Kumo, or may even try to attack the bottom of the cloud to retest horizontal supp/res levels ard 2,85-2,90.
Please remember, that even if Price dips below the Kumo, that can not be called a firm bearish reversal on the daily chart. For a valid and sustainable bearish Kumo breakout Price always have to clear previous key horizontal level, in this case 2,85! If it trades below 2,85, from that point we can start to look for sell signals to enter a strategic bearish positions.
- Heikin Ashi signal is bearish.
Strategy: For those who are already in a swing short position, it is still ok to hold the shorts, and trail the protective stops. Those who are long, well they have to ask why they are still long? Those who do not have any positions on this cross it is wise not to do anything right now, as there is no good risk-reward trade setup here in the middle of the cloud, and for new positions chances are almost equal to win or lose.
p.s.:
I am really happy that one friend who is a follower of mine asked me to check this chart. Not because I trade BRL, but because I have position on Sugar futures, and as we know, Brazil is one of the biggest producers, so regarding sugar price action, USDBRL matters a lot.
You can find a link to my Sugar post below.
p.s.2: the more I look at the charts of different USD crosses and at DXY, the stronger feeling I have about the end of the 11 months USD bull mkt. I think from May to Aug we will see a massive USD long unwind generally and a deep correction. From August the bull may resume if mkt starts to focus on chances of FED rate hikes again.


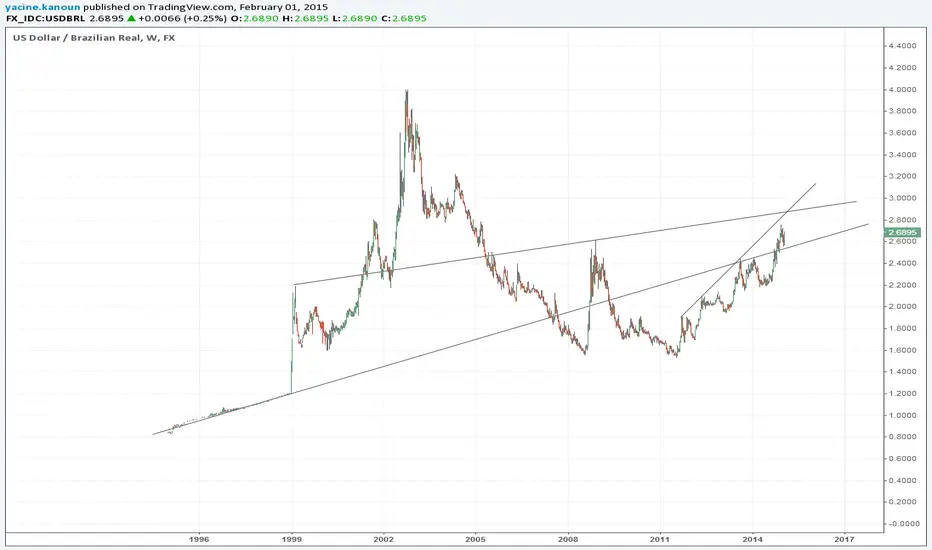
Brasil - Chaos into Opportunity soon
Something very negative is going on in Brasil for various reasons.
This will lead to a great opportunity to buy the currency, the equities, the Sugar.
This chart suggests that if 4.00 is reached again it could be the overall bottom for the country.