THETA @ resistance Theta grinding against resistance and ready for a huge move. Hope you’re ready. Prepared for the worst but still praying for the best
THETAUSD trade ideas

$THETAUSD - Inverted head and shouldersHello everyone!
THETHAUSD tested the major support level and is ready to jump.
You can buy now or wait for a breakout from the triangle (dashed line).
There also is a possible bat pattern, so don't get scared if it retraces a little.

triangulation gets smallerTheta is finishing it's windup. It will be a maximum date of Oct. 29 before theta breaks triangulation and at that point, it will be going up.

THEATUSDT : Are you ready to be H&S pattern ?
Finally ,it broke out the short term downtrend and the short term TP1 is 7.0135
If it can break out the neckline ,trading strategy as below
TP2:7.653
TP3:7.912
TP4:8.190
If you like this analysis, give it a like or share your thought or let me know what crypto TA you want to know.

- 15x?$THETA cup and handle potential$THETA could be forming a cup and handle forming over the entire year. We are close to jumping out of triangulation, which will a historical beginning to the $THETA bullrun of fall 2021.

THETA- How do we 15x ?$THETA could be forming a cup and handle forming over the entire year. We are close to jumping out of triangulation, which will a historical beginning to the $THETA bullrun of fall 2021.

Theta Network (THETA) - October 21Hello?
Welcome, traders.
By "following", you can always get new information quickly.
Please also click "Like".
Have a nice day.
-------------------------------------
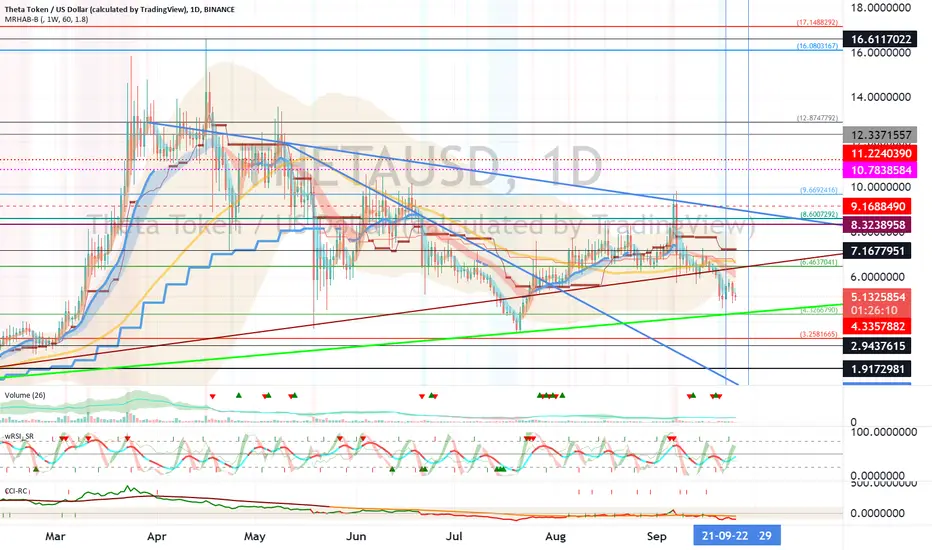
(THETAUSD 1W Chart) - Mid-Long-Term Perspective
Above the 1.9172981 point: the uptrend expected to continue
Above 4.3357882 point: Expected to create a new wave.
(1D chart)
First resistance zone: near 6.4637041
Second resistance section: 8.6007292-9.6692416
Support section: 3.2581665-4.3266790
We need to break above the first resistance zone and see if we can find support above the 6.9164138 point.
If not, you need to check whether the price is maintained in the range 4.3266790-6.4637041.
If the price declines from the support zone, a short-term Stop Loss is required as further declines may occur.
However, it may touch near the 1.9172981 point and rebound, so you should think about how to react.
To accelerate the uptrend, it needs to rise above the second resistance section.
------------------------------------------
(THETABTC 1W Chart) - Mid-Long-Term Perspective
Above the 0.0000405-0.0000523 section: expected to continue uptrend
(1D chart)
Resistance section: near point 0.0001237
Support period: 0.0000671-0.0000860
If you look at the chart of the BTC market, you can see to some extent whether the price can rise when the BTC price moves sideways after it rises.
When the BTC price rises, the price of the tokens traded in the BTC market naturally decreases.
However, tokens that show support in a certain section of the BTC market token price or show an upward trend are more likely to show a sharp rise when the BTC price moves sideways.
If you look at the THETABTC 1D chart from this point of view, it is maintaining a downtrend, so when the altcoin bull market starts, there is a high probability that the price will rise in the second order.
Among the indicators used in my chart, there are indicators that can confirm the trend, but I think that by checking the chart of the BTC market like this, you can see the trend more accurately.
------------------------------------------
We recommend that you trade with your average unit price.
This is because, if the price is below your average unit price, whether it is in an uptrend or in a downtrend, there is a high possibility that you will not be able to get a big profit due to the psychological burden.
The center of all trading starts with the average unit price at which you start trading.
If you ignore this, you may be trading in the wrong direction.
Therefore, it is important to find a way to lower the average unit price and adjust the proportion of the investment, ultimately allowing the funds corresponding to the profits to regenerate themselves.
------------------------------------------------------------ -----------------------------------------------------
** All indicators are lagging indicators.
Therefore, it is important to be aware that the indicator moves accordingly with the movement of price and volume.
However, for the sake of convenience, we are talking in reverse for the interpretation of the indicator.
** The MRHAB-O and MRHAB-B indicators used in the chart are indicators of our channel that have not yet been released.
(Because it is not public, you can use this chart without any restrictions by sharing this chart and copying and pasting the indicators.)
** The wRSI_SR indicator is an indicator created by adding settings and options to the existing Stochastic RSI indicator.
Therefore, the interpretation is the same as the traditional Stochastic RSI indicator. (K, D line -> R, S line)
** The OBV indicator was re-created by applying a formula to the DepthHouse Trading indicator, an indicator disclosed by oh92. (Thanks for this.)
** Support or resistance is based on the closing price of the 1D chart.
** All descriptions are for reference only and do not guarantee a profit or loss in investment.
(Short-term Stop Loss can be said to be a point where profit and loss can be preserved or additional entry can be made through split trading. It is a short-term investment perspective.)

$THETA Bullish Gartley continuationDownsloping consolidation is breaking here with a couple smaller harmonics within the zone, The Gartley often targets the 1.618 if you wanted to add another tp target. 8.37 may be a zone to look out for as well. In elliott wave theory the impulse wave here will reach the 1.618 extensions of its initial wave up.

The only TA you need to worry aboutThe line measures the downtrend from the May peak. We are now approaching our time in the crypto bullrun. BTC will become volatile, and then go parabolic. We will be quickly behind it. Pump goes BTC > mid tier alts > shitcoins. When we close 1D above the blue line, it's on.

New pattern and new plan in THETA 4h
In last post about THETA it went down after hit TP2 and retest the support .
There is a potential H&S pattern in the chart.
If it can break out the downtrend and we setup the new plan
SL:5.915
TP1:7.013
If it break out the neckline and H&S will be confirmation .
We can hold and wait for next targets below
TP2:7.653
TP3:7.912
TP4:8.190
If you like this analysis, give it a like or share your thought or let me know what crypto TA you want to know.

Looks BullishEW counts suggesting higher highs to come, Wave 4 low appears to be in but may not be (unlikely), Setup overall looks pretty solid also not sure how accurate my timeline is on this > pay more attention to price targets opposed to timing.

THETAUSD PRICE PREDICTION WTF HAPPENNED WITH THETA.
It has done a 10,000% run.
And now gearing up for another 2000%
- January: $44
- July: $123
NFA


THETAUSD D4: THE BEST Level to BUY/HOLD 700%+ gains(SL/TP)(NEW)Why get subbed to me on Tradingview?
-TOP author on TradingView
-2000+ ideas published
-15+ years experience in markets
-Professional chart break downs
-Supply/Demand Zones
-TD9 counts / combo review
-Key S/R levels
-No junk on my charts
-Frequent updates
-Covering FX/crypto/US stocks
-before/after analysis
-24/7 uptime so constant updates
🎁Please hit the like button and
🎁Leave a comment to support our team!
THETAUSD D4: THE BEST Level to BUY/HOLD 700%+ gains(SL/TP)(NEW)
IMPORTANT NOTE: speculative setup. do your own
due dill. use STOP LOSS. don't overleverage.
🔸 Summary and potential trade setup
::: THETAUSDT D4 chart review
::: updated/revised outlook
::: overall strong chart
::: BULL FLAG pattern
::: focus on buying lower later
::: final swipe lower possible/likely
::: but then expect MASSIVE GAINS
::: chart looks good /strong
::: still valid today / great setup BULLS
::: BULL FLAG setup with massive upside
::: still expecting pullback off the highs
::: get ready to BUY LOW later
::: accumulation in range previously
::: then we had 650% gains PUMP
::: we had 2 pumps already before this
::: 650% pump - pullback
::: then 650% pump and now pullback mode
::: expecting short-term pullback
::: BULLS get ready to BUY after pullback
::: TP bulls is +700% gains later
::: expecting decent gains soon
::: 30-40% pullback short-term
::: recommended strategy: BUY/HOLD after pullback
::: TP BULLS +700% gains
::: SWING TRADE: BUY/HOLD IT
::: bull run not over yet
::: good luck traders!
::: BUY/HOLD and get paid. period.
🔸 Supply/Demand Zones
::: N/A
::: N/A
🔸 Other noteworthy technicals/fundies
::: TD9 /Combo update: N/A
::: Sentiment mid-term: BULLS
::: Sentiment short-term: BEARS/PULLBACK
RISK DISCLAIMER:
Trading Crypto, Futures , Forex, CFDs and Stocks involves a risk of loss.
Please consider carefully if such trading is appropriate for you.
Past performance is not indicative of future results.
Always limit your leverage and use tight stop loss.

THETA retested Fib 0.618 and ready to breakout !In THETAUSDT 4h
It retested the Fib level 0.618(5.673) and rebound quickly and it is also the neckline of double bottom
It means the support confirmation .
If it can breakout the downtrend with short upper shadow
Let 's setup
TP1:6.738
TP2:6.918
TP3:7.302
TP4:7.925
SL:5.710

THETA looks ready to go 27th of September 2021Hi guys,
THETA seems to have broken the downtrend and is currently re-testing the resistance.
I entered a spot position in the 5$ area and targeting the ATH at 15$ in the next 30 to 40 days.
We can spot a bull div on the MACD indicator and a bull cross on the MA's.
Will be buying more if the price continues to drop in the 3.40$ area.
Not financial advice, trade safely peeps !

THETA - One Day You'll RealiseThat my projection before the crash of THETA going to $1 was actually quite modest.
LL coming soon enough.
Not advice.

Theta Network (THETA) - September 26Hello?
Welcome, traders.
By "following", you can always get new information quickly.
Please also click "Like".
Have a nice day.
-------------------------------------
(THETAUSD 1W Chart) - Mid-Long-Term Perspective
Above the 1.9172981-2.9437615 interval: the uptrend continues.
(1D chart)
Support section: 3.2581665-4.3266790
If the decline is from the support area, it could be near the 1.9172981 point, so trade with caution.
Resistance section: 6.4637041-7.1677951
--------------------------------------
(THETABTC 1W Chart) - Mid-Long-Term Perspective
Above the 0.000523-0.0000753 interval: the uptrend is sustainable.
(1D chart)
Decrease in the 0.0001116-0.0001243 section: Stop Loss required to preserve profit and loss.
Resistance section: 0.0001614-0.0001803
------------------------------------------
We recommend that you trade with your average unit price.
This is because, if the price is below your average unit price, whether it is in an uptrend or in a downtrend, there is a high possibility that you will not be able to get a big profit due to the psychological burden.
The center of all trading starts with the average unit price at which you start trading.
If you ignore this, you may be trading in the wrong direction.
Therefore, it is important to find a way to lower the average unit price and adjust the proportion of the investment, ultimately allowing the funds corresponding to the profits to regenerate themselves.
------------------------------------------------------------ -----------------------------------------------------
** All indicators are lagging indicators.
Therefore, it is important to be aware that the indicator moves accordingly as price and volume move.
However, for the sake of convenience, we are talking in reverse for the interpretation of the indicator.
** The MRHAB-O and MRHAB-B indicators used in the chart are indicators of our channel that have not been released yet.
(Because it is not public, you can use this chart without any restrictions by sharing this chart and copying and pasting the indicators.)
** The wRSI_SR indicator is an indicator created by adding settings and options to the existing Stochastic RSI indicator.
Therefore, the interpretation is the same as the traditional Stochastic RSI indicator. (K, D line -> R, S line)
** The OBV indicator was re-created by applying a formula to the DepthHouse Trading indicator, an indicator disclosed by oh92. (Thanks for this.)
** Support or resistance is based on the closing price of the 1D chart.
** All descriptions are for reference only and do not guarantee a profit or loss in investment.
(Short-term Stop Loss can be said to be a point where profit and loss can be preserved or additional entry through split trading. It is a short-term investment perspective.)
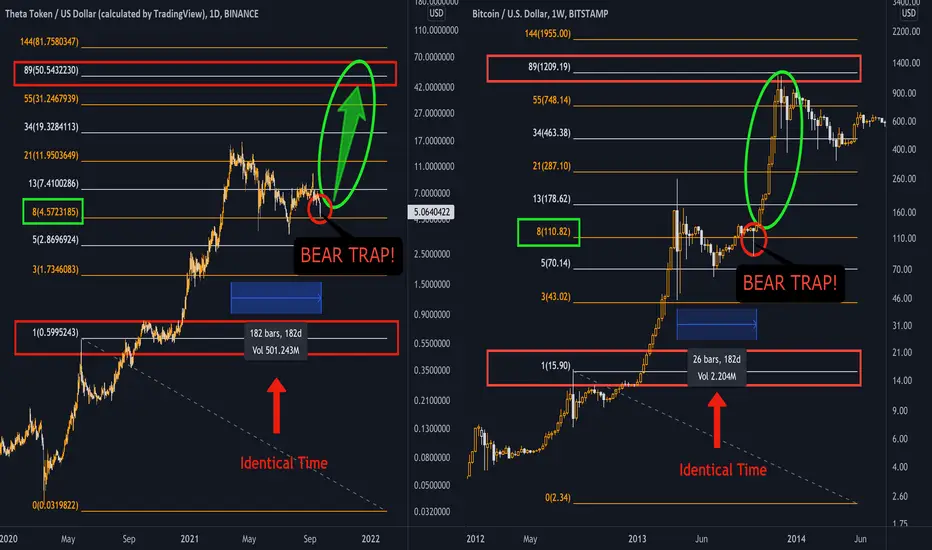
Theta 2021 / Bitcoin 2013This Fractal tells me everything I need to know about Theta. It's about to pull an early Bitcoin type move!!

THETAUSDT recommended buy zone &targetprice distanced from the long term parabolic line ,and in the middle time breakdown the channel .
it seems Another wave of correction on the way And the buying position will come.

Theta Network (THETA) - September 6Hello?
Welcome, traders.
By "following", you can always get new information quickly.
Please also click "Like".
Have a nice day.
-------------------------------------
(THETAUSD 1W Chart)
The support section is not properly formed.
However, if the price is maintained above the 1.9172981-2.9437615 range, it is expected to continue the upward trend.
(1D chart)
If the price is maintained in the range of 6.4637041-8.6007292, the uptrend is expected to continue.
The 8.6007292-9.6692416 section is resistance and we need to see if we can break through it upwards.
To accelerate the uptrend, it needs to rise above the 9.6692416 point.
If it falls from the 2.9437615 point, you need a Stop Loss to preserve your profit.
-------------------------------------
(THETABTC 1W chart)
The support section is not properly formed.
However, if the price is maintained above the 7530 Satoshi point, it is expected that the upward trend will continue.
(1D chart)
You need to check if you can get support by ascending to the 16140 Satoshi-18030 Satoshi section.
If the price is maintained in the 12370 satoshi-16140 satoshi range, it is expected to turn into an upward trend.
However, in order to continue the upward trend, it must rise above the 18030 Satoshi point.
If it falls from the 12370 Satoshi point, Stop Loss is required to preserve profit and loss.
------------------------------------------
We recommend that you trade with your average unit price.
This is because, if the price is below your average unit price, whether it is in an uptrend or in a downtrend, there is a high possibility that you will not be able to get a big profit due to the psychological burden.
The center of all trading starts with the average unit price at which you start trading.
If you ignore this, you may be trading in the wrong direction.
Therefore, it is important to find a way to lower the average unit price and adjust the proportion of the investment, ultimately allowing the funds corresponding to the profits to regenerate themselves.
------------------------------------------------------------ -----------------------------------------------------
** All indicators are lagging indicators.
Therefore, it is important to be aware that the indicator moves accordingly with the movement of price and volume.
However, for the sake of convenience, we are talking in reverse for the interpretation of the indicator.
** The wRSI_SR indicator is an indicator created by adding settings and options to the existing Stochastic RSI indicator.
Therefore, the interpretation is the same as the traditional Stochastic RSI indicator. (K, D line -> R, S line)
** The OBV indicator was re-created by applying the formula to the DepthHouse Trading indicator, an indicator disclosed by oh92. (Thanks for this.)
** See support, resistance, and abbreviation points.
** Support or resistance is based on the closing price of the 1D chart.
** All descriptions are for reference only and do not guarantee a profit or loss in investment.
Explanation of abbreviations displayed in the chart
R: A point or section of resistance that requires a response to preserve profits.
S-L: Stop Loss point or section
S: A point or section where you can buy to make a profit as a support point or section.
(Short-term Stop Loss can be said to be a point where profit and loss can be preserved or additional entry can be made through split trading. It is a short-term investment perspective.)
GAP refers to the difference in prices that occurred when the stock market, CME, and BAKKT exchanges were closed because they are not traded 24 hours a day.
G1 : Closing price when closed
G2: Opening price
(Example) Gap (G1-G2)

TFUELUSD 4H might break-out the falling wedge.In TFUELUSD 4H
If the price can break-out the downtrend with short upper shadow.
We can setup the plan like
TP 1: Fib 1 (8.333)
TP 2: Fib 1.272~1.382(9.094~9.401)
TP 3: Fib 2(11.129)
SL: 6.899
