STMXUSDT.P long opportunityOn the H4 chart of STMXUSDT.P, it seems that the price is completing an ABCDE triangle pattern within the 4th Elliott wave of a bullish cycle. Planning to go long with targets in the 5th wave.
STMXUSDT.P trade ideas

STMX target 0.008~0.014h time frame
-
STMX breaking above the triangle.
Confirmation of Breakout would be the timing to open long.
Trading plan is set as below.
TP: 0.008~0.01 / 0.0109 / 0.012
SL: 0.0062

$STMX breakout Bullish SymmetricalWhat is a Symmetrical Triangle
A symmetrical triangle is a chart pattern characterized by two converging trend lines connecting a series of sequential peaks and troughs. These trend lines should be converging at a roughly equal slope. Trend lines that are converging at unequal slopes are referred to as a rising wedge, falling wedge, ascending triangle, or descending triangle.
KEY TAKEAWAYS
Symmetrical triangles occur when a security's price is consolidating in a way that generates two converging trend lines with similar slopes.
The breakout or breakdown targets for a symmetrical triangle is equal to the distance between the initial high and low applied to the breakout or breakdown point.
Many traders use symmetrical triangles in conjunction with other forms of technical analysis that act as a confirmation.


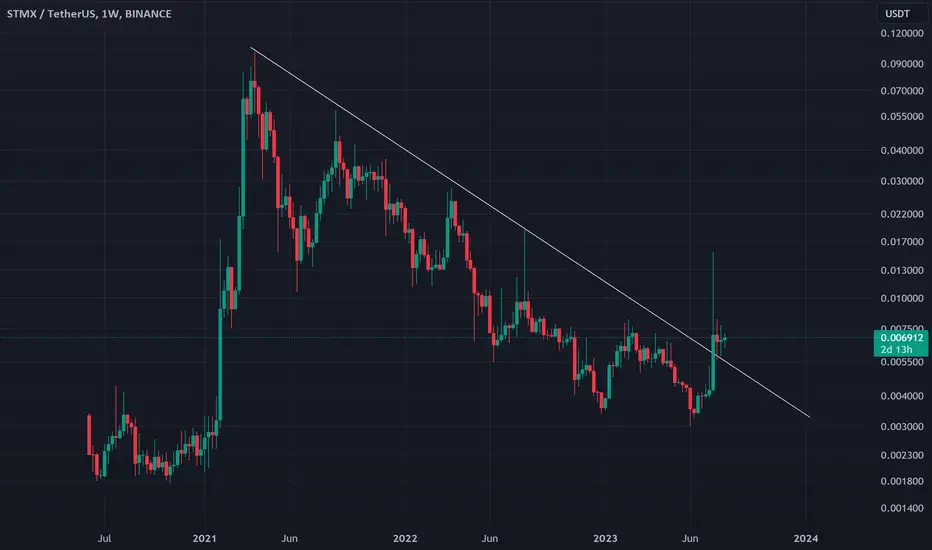
STMX broke a main trend Regardless that I believe STMX is a bad coin, STMX broke a weekly trend and retested perfectly we can see double in the near future.
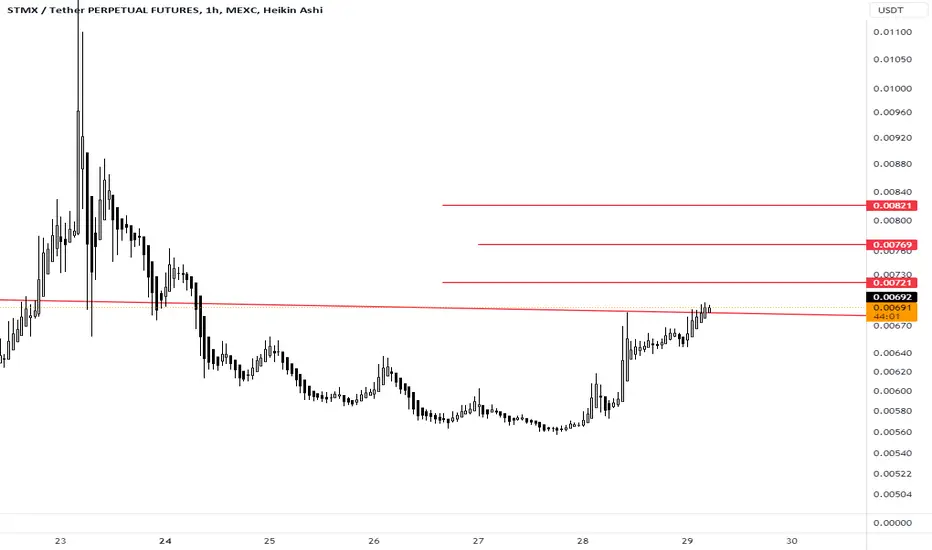
You can divide your entry position as following :
1- you can buy it now
2- you can buy if the price touch the support again.
have a nice trade
Follow me for the next analysis of SNM coin and be ready because it will be something big.
STMXUSDTSTMXUSDT was trading in symmetrical triangle and now has given the breakout from triangle.
If this breakout sustained , bulls can ride it to 0.8390 level , which almost 25% from local support area.
Will the bulls avail this opportunity and will get the minimum ride of 25% ?

harmonic pattern Based on the obtained pattern and the minimum stop-loss threshold, we can examine this matter, and if we observe a similar trend with your trading strategy, we can enter this trade.

STMX ShortSTMX symmetrical triangle formation.
Once price breaks the lower trendline support area.
We will open a short in STMX .
TP 0.0050$ ✅
We will share call upon confirmation

Short STMXUSDTShorting STMX from 0.01165 with intial Target 0.01 then 0.009 and 0.006 with extension.
Enjoy Short

StormX (STMX)StormX is one of the pioneers in the online crypto market in which users can get cashback in crypto for most of their online purchases using the mobile app or browser extension. StormX has partnered with big companies like Nike, Adidas, New Balance, Samsung, Lego, and more. Anyway, it is evident that after a huge rise in price, STMX entered a correction phase for a long time. Recently, STMX broke the downtrend line and now it seems an uptrend move has started. Let's see what happens.

STMXUSDT IDEAHello Trading view Family / Fellow Traders.
I hope you have used and benifited from the previous analysis .
In today trading session we are monitoring STMXUSDT for a buying opportunity, once we will receive any bullish confirmation the trade will be executed.
If this post was useful to you do not forget to like and comment.

Stmx Getting ready For Another bullish Impulse Seems Like still Up Trend Is strong & breaking bullish Pennant in h4 Timeframe Incase Of Successful Breakout expecting Another Massive Bullish Impulse Incase Of Successful Breakout expecting 80 to 85% bullish Rally

$STMX$STMX/USDT
On a daily timeframe level, the price action of $STMX Formed out Symmetrical Triangle pattern level where the price action is respecting on its Support Trendline and Horizontal Support level
We can expect the bounce back level from there

STMX BUY SETUPHi, dear traders. how are you ? Today we have a viewpoint to BUY/LONG the STMX symbol.
For risk management, please don't forget stop loss and capital management
When we reach the first target, save some profit and then change the stop to entry
Comment if you have any questions
Thank You


STMXUSDT POSSIBLE SHORT CHANCEAs you can see in STMX, there is a shoulder head shoulder pattern, although it is not very symmetrical. But in 4 hours, if the candle closes below the line I draw, there may be a chance to open a short (it may be a trap). Also, profit sales can be made in the green boxes I draw (it is more logical to determine your profit yourself).
DEFINITELY NOT INVESTMENT ADVICE!!!

Short STMXSharing my first idea for a short on a failed bull pennant break out. Target down to .0065

$STMX, One of the few on the green today,$STMX
One of the few on the green today, will see if it can keep it this way with some much bearishness across the board.
UCTS 2D Buy signal a few days ago (20%+ up in profit so far)

stmxI am waiting for the collision on each of the red lines of the direction, the correction towards the trend line
The support and resistance area around 0.007740 is importantHello?
Traders, welcome.
If you "Follow", you can always get new information quickly.
Please also click "Boost".
Have a good day.
-------------------------------------
(STMXUSDT chart)
(1M chart)
The key is whether it can find support above 0.005660 and rise above the MS-Signal indicator.
(1W chart)
Therefore, if it rises above 0.007740 and shows support, it is a buying time from a mid- to long-term perspective.
(1D chart)
From a short-term perspective, there is an uptrend as the price is holding above the HA-High indicator on the 1D chart.
However, if you refer to the explanations of the 1M chart and 1W chart, the important point is whether it can rise with support in the 0.005660-0.007740 range.
If supported and raised in this way,
1st: 0.012750
2nd: 0.019146-0.020898
The area around the 1st and 2nd above corresponds to the split selling section.
Therefore, it is recommended to proceed with buying when the HA-Low indicator or HA-High indicator on the 1D chart is newly created and shows support from the indicator.
------------------------------------------
There are a few coins (tokens) that are showing a lot of uptrend that I feel like I won't have a chance to buy unless I buy them right now.
However, if you look closely at support and resistance points, there are only a handful of coins (tokens) that break through significant support and resistance points upwards.
Therefore, you need to be very careful when trading coins (tokens) that are currently skyrocketing.
-------------------------------------------------- -------------------------------------------
** All descriptions are for reference only and do not guarantee profit or loss in investment.
** Even if you know other people's know-how, it takes a considerable period of time to make it your own.
** This is a chart created with my know-how.
---------------------------------

STMX COIN NEXT POSSIBLE MOVE!! STMX TRADE SETUP !$STMX Coin Update &Possible Move !!
• weekly candle bearish & almost in last 4 days price almost drop 37%+ without liquidation wick.
• MACD &RSI are Bearish on 1D &4H tf.
• Bounce back expected from its support area. ( fundametally weak so longterm trade not recomanded.
FOLLOW FOR MORE

STMX LIMIT SHORT FROM 0.0062STMX LIMIT SHORT FROM 0.0062 - STMX is very bullish, however it has some resistance
Put a limit sell to 0.0062 and wait
If BTC holds 29.5-30k range it could happen
