Solana daily Review !In 1 Hour Time frame:
Can See:
- EQL Line, which is the Last Saturday High
- Monday Low
- SellSide Liquidity
- Can Mark the Weekly opening Also
What do you see else?
SOLUSDT.P trade ideas

Daily Review 1 HTF!In 1 Hour Time frame:
Can See:
- EQL Line, which is the Last Saturday High
- Monday Low
- SellSide Liquidity
- Can Mark the Weekly opening Also
What do you see else?

Weekly Review!What I see in this chart?
- The bios is Bullish, considering the Weekly FVG(in Blue Color)
- Monday Definitely is Bullish.
- Mark The last week High.
- Mark also the 50% of 2 last week High using Fibonacci.
- If Today, I see a Big movement of Price Action, Decide to trade or not!
- Wait Till NY Session!
Appreciated if you share your kind Idea with me!

Week Review!What I see in this chart?
- The bios is Bullish, considering the Weekly FVG(in Blue Color)
- Monday Definitely is Bullish.
- Mark The last week High.
- Mark also the 50% of 2 last week High using Fibonacci.
- If Today, I see a Big movement of Price Action, Decide to trade or not!
- Wait Till NY Session!
Appreciated if you share your kind Idea with me!

SOLUSDT LONGA bullish flag pattern could be observed with the testing of 0.382 fib. Therefore going long on SOLUSDT

SOLUSDT BULLISHBeing one of the best performing altcoins, SOL still hasn't reached it's all time highs. I am expecting a huge impulse on SOLANA until it doesnt break the lower leg. DYOR

$SOLCRYPTOCAP:SOL
$156.5 - $150 fantastic area to bid for higher targets, expecting big moves in the future from SOL so will be looking to add to my bags here.

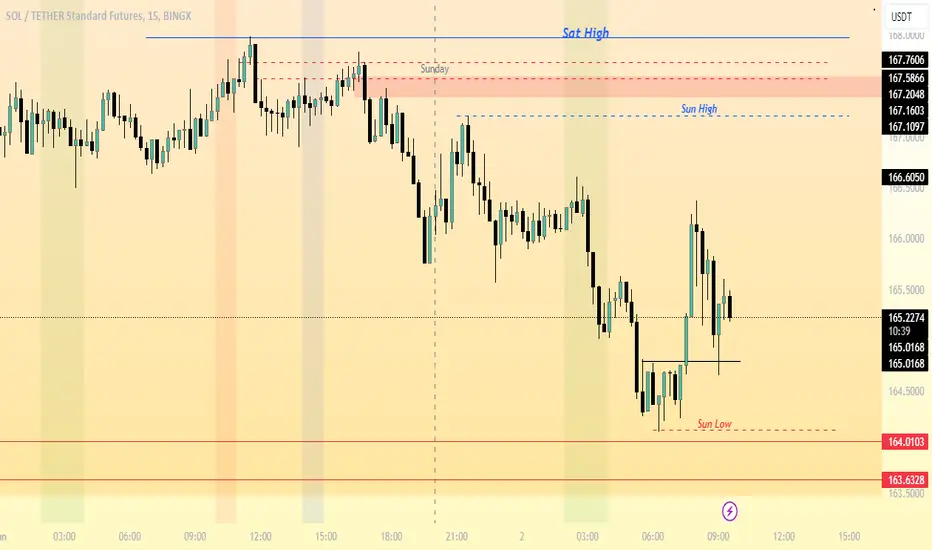
Solana Has no Weekend?Solana was resting yesterday!
Lets see whats move today!
Do Break the Sunday High or Saturday High?
Can Get Short Position on NY session or Pm Session?
I am looking for short Position!
You?

Short on Solana!I should took the position from the entry point of 171... BUT I MISSED!
Lets see is it hont my TP? maybe will be 160 or 150?

Is it going to 152?I should took the position from the entry point of 171... BUT I MISSED!
Lets see is it hont my TP?

$SOL break down the trend line#sol #solana price needs to reclaim the trend line zone, therefore #solusd will perform a bearish retest. Unsuccesful retest will likely bring a dump or reclaiming the zone will invalidate.

SOLUSDTHead and shoulders pattern, neckline should be broken soon. Either wait for strong break or neckline or you can enter short trade just now.
More later, good luck

Look for 10 Handels on SolanaLook for 10 handels (I think its = 25pips on Forex) in NY Session.
London Session was good but i could not focus on it...and waiting for NY Session...
For me 10 Handels is about diffrences 22 Solana,

Daily trading Plan for BTC SOL NEAR RUNEPlease view and review my daily trading plan for BTC SOL NEAR and RUNE. Please if you have any questions please leave a comments

SOL USDTOne messed up chart with all the confluences on the bearish side. expecting price to move lower.

Solana (SOL) Breakout Signals Major Upside PotentialSolana (SOL) has emerged as a formidable player in the cryptocurrency space, boasting superior transaction speed, low fees, and remarkable scalability. These attributes position Solana as a leading candidate for substantial growth, setting it apart from other similar coins.
Technical Analysis:
The daily chart of Solana reveals a significant bullish development. On May 15, 2024, Solana experienced a breakout from a consolidation box, a move confirmed by the FCT (Box Breakout) indicator. This breakout is a robust signal of increased buying pressure and potential for further gains. Additionally, Solana is trading comfortably above both the 24-day and 150-day moving averages, underscoring the prevailing bullish trend.
Key Technical Indicators:
Breakout Date: May 15, 2024
Indicators Used: FCT (Box Breakout), 24-day Moving Average, 150-day Moving Average
Current Price Level: Above 24-day and 150-day moving averages
Trend: Strong bullish momentum
Price Target:
Given the current technical setup and market sentiment, we anticipate Solana's price to reach the $250 to $275 range per coin in the near term. This target is derived from the measured move of the breakout and the strong underlying fundamentals supporting Solana.
Investment Thesis:
Transaction Speed and Scalability: Solana can process up to 65,000 transactions per second (TPS), far exceeding the capabilities of many other blockchain platforms, including Ethereum. This speed, coupled with low transaction fees, makes Solana an attractive option for developers and users alike.
Innovative Technology: Solana’s unique Proof of History (PoH) mechanism, which works in conjunction with Proof of Stake (PoS), enhances its scalability and efficiency. This technological edge provides a strong foundation for long-term growth.
Ecosystem Growth: Solana’s ecosystem is rapidly expanding, with an increasing number of decentralized applications (dApps) and projects being built on its platform. This growth fosters network effects and adds intrinsic value to the SOL token.
Institutional Interest: Solana has been attracting significant institutional interest, further validating its potential and providing additional liquidity and stability to the market.
Recent Developments:
Breakout Confirmation: The breakout from the consolidation box on May 15, 2024, marks a critical turning point. The FCT indicator's confirmation adds credibility to this move, suggesting sustained upward momentum.
Moving Averages: Trading above the 24-day and 150-day moving averages highlights strong buying interest and investor confidence in Solana’s long-term prospects.
Price Projections and Risk Management:
Short-Term Target: $250 - $275 per coin
Support Levels: Initial support around $180 (previous resistance turned support)
Risk Management: Investors should consider placing stop-loss orders below the $180 support level to manage potential downside risk.
Chart Analysis:
The chart illustrates Solana’s breakout and current trading levels above key moving averages. The annotated chart also highlights the consolidation box and the breakout point, providing a visual representation of the bullish setup.
Conclusion:
Solana’s combination of innovative technology, rapid ecosystem growth, and strong technical indicators make it a compelling investment opportunity. The recent bullish breakout and sustained trend above critical moving averages point to further upside potential. Investors looking to capitalize on this opportunity should consider Solana for their portfolios, targeting the $250 to $275 range per coin.
Stay tuned for further updates and happy trading!
Disclaimer:
This analysis is for informational purposes only and does not constitute financial advice. Always conduct your own research and consider your risk tolerance before making investment decisions.


SOLUSDT | Long H4 | Buy Limit | Technical Confluences for Trade:
- Stochastics are in Overbought Conditions on D1, H4 & H1 time-frame to activate our trade idea
- Entry level will be a Demand Zone for Solana
- Price action is in a consolidation zone
- Targeting the 61.8% Fibo retracement after trade is activated
Suggested Trade:
Buy Limit @ 123.15
SL @ 110.24
TP 1 @ 143.74 (Close Half-Position & move SL to Entry level once TP1 is achieved)
TP 2 @ 169.42
Risk-to-Reward @ Approx. 3.26 (Depending on Entry Level)
________________________________
Boosts 🚀, Follows ✌️, Shares 🙌 & Comments ✍️ are much appreciated!
If you have any ideas or charts, do share them in the 'Comments' section below and we can discuss our perspectives to improve or strengthen our strategies.
If you want something analyzed, do drop me a DM. :D
________________________________
Disclaimer: The above suggestion is an personal opinion in general and does not constitute as investment advice. Any decisions taken based on the above suggestion is purely your own risks.
Any websites / brokers / applications suggested here are also provided as informational purpose only.
________________________________

sol usdtif btc maintains the range between 63000 to 65000 then we can see some relief is alts. Sol looks like making a Head and shoulders pattern. Will be confirmed once the upper resistance is broke.

BULLISH FLIP SOLANA- BUY SIGNAL Let if Fly,🚀 Big week for #Solana!
flipped bullish at $153.
Get ready!
BUY SIGNAL

SOl Awaiting Confirmation Amidst Key LevelsThere is a cascade of levels ahead - we might see a small impulse, but on the daily chart, the coin has already moved significantly, so I don't expect a strong move. I've marked the targets and will enter after confirmation.

wow We see a very nice growth of 1080% from the bottom of the green channel and
from the strong green support zone.
Now there is a solid red resistance band in front of it.
Possible failure of this band means the next beautiful growth
