$SAND LONGAnother great setup.
Double bottom at fib level
Risk, targets and RR marked on chart
Long term project to get to all targets
SANUSD trade ideas

SAND potential Buy#SAND 1D @harmonictrader #Bat TBar + TYPE-II. Would like to see price close above PRZ resistance @ 3.70 before entering Bullish position. Happy Trading Everyone!!

How MM's work..How MM's work.. Manipulating and buying dips (=investing) to sell with giant profits.


SANDSAND bullish TA from technical + fundamental TA
Find entry, sl n tp in TA
Trade safe...
NB: Patience + risk management is key to winning trades.
Sand short setupSand short setup
30 % gain in sand short setup
Sand short setup
30 % gain in sand short setup

Sand OutlookSand chart is simple. As long as it is in this descending trendline, it will not go up. It is also way lower than LSMA crossover 4H! In order to exit from this descending trendline, it should first break this trendline and then stay ahead of LSMA crossover line. Good lock.

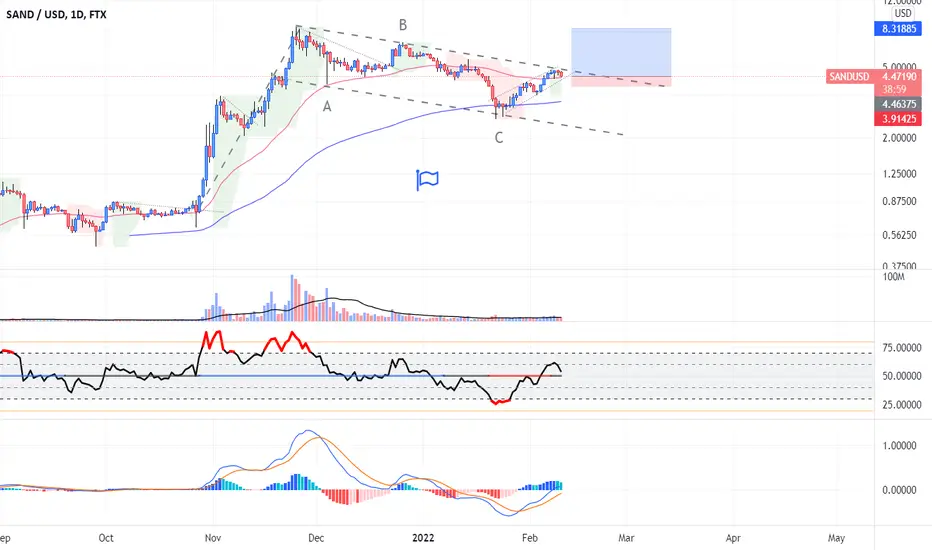
SANDUSD | A final correction before the pump Hi everyone,
I would like to show you how SAND could evolve to my own opinion based on waves analysis.
First, as we can see we probably have reached our bottom on SAND around $2.55. If you have reloaded your positions during this last correction you have made a very good decision ! However, if you haven't done so, don't worry, you will have the opportunity to place again in our wave 2 correction.
Then, we are currently on the formation of our minor wave 5 which will complete wave 1 in order to start our correction phase on our wave 2. This one should approximately reach the 0.618 Fibonacci retracement before starting the big rebound.
Next, if this scenario is validated we can turn to our $10 goal during our wave 3 but we must be patient.
Finally, a quick update on the fundamentals of The Sandbox project. The adoption of the metaverse proposed by Sébastien Borget's team is progressing steadily. Indeed, several large companies are already starting to invest in plots like Ubisoft, Carrefour or Gucci and many others. The future of The Sandbox promises to be much brighter than we had hoped.
So we remain focused and above all we remain cautious.
Let's give SAND time to validate this analysis.
If you agree with this scenario let me know with a like.
Otherwise let me know your point of view with a comment, thank you !
(This is my own hypothesis and in no way suggests a buy or sell advice.)

SANDUSD Bull FlagSANDUSD seems to be forming a bull flag with the ABC correction pattern forming. We might be able to see a breakout soon or the price will break down which signals an ABCDE correction.
SANDUSD (4H Timeframe) Bearish reversalHi Traders
SANDUSD (4H Timeframe)
Waiting for the downward break of 4.31 support level which will complete a bearish trend reversal pattern to go SHORT. Only the upward break of 4.87 would cancel the bearish scenario.
Trade details
Entry: 4.31
Stop loss: 4.87
Take profit 1: 3.96
Take profit 2: 3.39
Score: 6
Strategy: Bearish reversal

SAND Bullish Price Action Outlook
Hello traders:
Beginning to see many of the crypto pairs are having good bullish price action on the lower time frames that could lead to more upside move in the weeks to come.
Here on SAND, after the strong bullish impulse up, price naturally form into a bullish continuation correction.
With a few swing highs and lows to create the current flag structure we are seeing here, and within, a descending channel which reverse the price up.
Now that we are at the top of structure, best to wait for the impulse move pushing price out of the flag structure,
and form continuation correction as a confirmation to look for entry.
Alternatively, if price doesn't right away push up, one more move down to the lows of the structure is still possible,
and if there is bullish reversal price action at the bottom of the flag structure, it can still validate the potential buy if reversals form.
Thank you
DISCLAIMER:
-My forecast and analysis are NOT trading signals nor financial advice, you should not enter trades and invest solely on this information.

Sandbox could move close to $5 soon.🎯 Sandbox nicely reacted on the weekly zone, Broke thru the daily trendline.
As well it's creating higher highs and higher lows. I see the potential for moving the big POC (point of control)
This is a pre-plan M, W, D, H4 Time-frames trends and Parallel Channels. I will execute on the M30 at the institutional level if all conditions are met.
✅ Traders, you are welcome to share your charts, thoughts, and questions let's discuss it.
Wish you a good hunt !!
Dave FX Hunter ⚔
----------------------------------------------------------------------------------------------------------------------------------------------------------------------------------------------------------------------------------------
❗❗ This is Pre-plan
That means my view can change, depending on how the price will arrive at the level and what will be happening on the M30 in my level of interest for entry. Then I will decide if I will enter or not. So please don't just blindly follow this. The FX market is a quickly changing environment and it requires full focus on the levels for the precise entry with low risk.
❗❗ DISCLAIMER
We are the only one person who is responsible for our health, relationships, success, and money in our lives. So taking a risk on the markets based on this idea is only and only your decision. You deserve the profit and you are responsible for your potential loss. Any opinions, news, research, analyses, prices, or other information discussed in this presentation or linked to from this presentation are provided as general market commentary and do not constitute investment advice. The author of the analysis does not accept liability for any loss or damage.
❗❗ Legal Risk Disclosure
Trading foreign exchange or CFD on margin carries a high level of risk, and may not be suitable for all investors. The high degree of leverage can work against you as well as for you. Before deciding to trade foreign exchange you should carefully consider your investment objectives, level of experience, and risk appetite. The possibility that you could sustain a loss of some or all of your initial investment and therefore you should not invest money that you cannot afford to lose. You should be aware of all the risks associated with foreign exchange trading, and seek advice from an independent financial advisor.

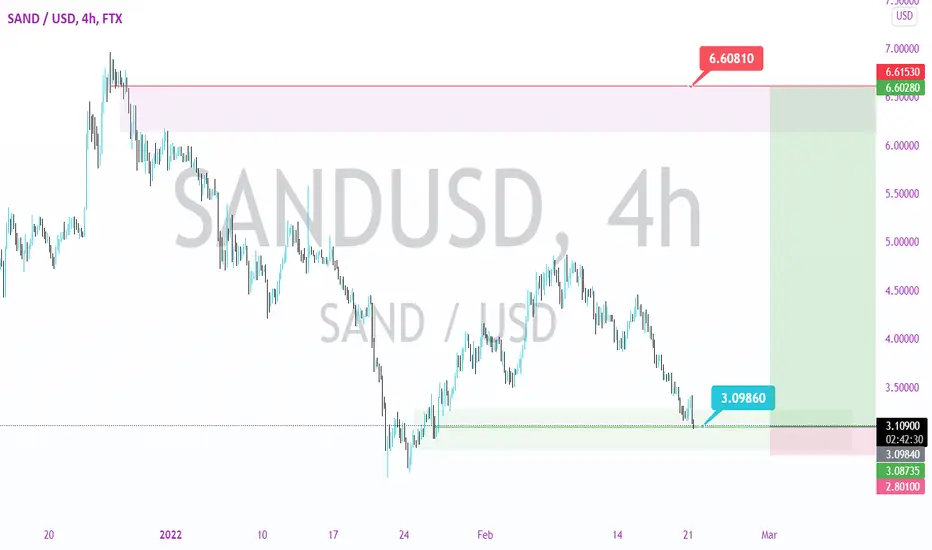
BREAKOUT IMMINENT ON SAND/USDT BULLISHSand has been on a major downtrend since its 8.48usdt ATH price level on November 25 2021, with a steady decline in volume. A potential breakout looks imminent once we are able to break out of the major downtrend and with the entire crypto market looking bullish again.

SAND - Long- Make a Quick BuckGreat BUY opportunity....Buy Low and Sell High.
30 days forecast = TP1
Like this idea ? Please do a thumbs up.
Thank you for watching.

WATCHOUT FOR A RETRACEMENT. POSSIBLY $4 TO $4.2Sand has rallied and currently sitting at the top of the ascending channel. retracement for correction to happen soon
Sand may see a retracement soon. Watch out $4 - $4.2 target.
KINDLY LIKE AND COMMENT.... HELP ME GROW HERE

SANDbox Beauty and perfectionIt is impossible to ask for more perfection to SANDbox. It has waves 1 and 2 (yellow) in place and is now at the heart of wave 3 (yellow). Wave 3 itself has 5 waves, of which wave 1 and 2 (white) have been built. Wave 3 of 3 (white) is in progress nad touched extension 1,236 and retraced to the 0,764 extension. This is textbook behavior. Now SAND is going to continue the upside movement to end wave 3, 4. and 5, which will complete all of wave 3 (yellow.). Ideal target is at 150. This is the region of confluence of 2,618 extension and 2,00 extension.

Update: #Sandbox #SAND 's 6 tasks on the daily chart ...Sandbox´s 6 tasks on the daily chart ...
1. break the FIB golden pocket (done)
2. break the RSI resistance (done)
3. hold the OBV support (done)
4. hold the FIB 0.786 and volume support (done)
5. flip the MA Ribbon bullish
6. confirm breakout(s) and have fun 😎
What do you think? 😎
Drop me a nice comment if you'd like me to analyze any other cryptocurrency.
*not financial advice
do your own research before investing

DigitalSurf: SANDUSDRecently just hearing of the Metaverse and deciding to take a look closer at SANDUSD (thanks for the idea, Big Dave). The all-time structure suggests that this NFT based virtual asset is currently in a diagonal wave for its Wave 5 move. Considering the present build of the said diagonal, it appears that it may develop in very volatile and aggressively bullish fashion.
I anticipate an upcoming test near the range of $10.
I also expect this test to find initial failure.
Upside pattern becomes immediately invalidated if the red line becomes broken.
For more analytical coverage of SANDUSD, BTCUSD and other promising cryptocurrencies, grab a board :)

SANDUSD Concentrated on technical analysisAccording to the chart we are wait for a bullish reversal patterns that will confirm the bulls are back in the market
If the bulls get back in the market we expecting sand to go as high as 24$ in the long run
Sand its one among crypto that have potential in the future world(meta verse)

Bullish DivergenceSANDUSD has made a higher low on the 1 hour timeframe but with a lower low on the RSI: oversold!
Taken a long position stoploss below red line.

SAND Looks like a textbook correction complete to me.Sometimes things really do look text book and its honestly so amazing to see it happen over and over, looking for longs

SAND Sandbox: 1D Chart ReviewHello friends, today you can review the technical analysis idea on a 1D linear scale chart for The Sandbox (SANDUSD).
The chart is self-explanatory. Price and RSI have been moving upwards and broke out of resistance areas. The price is in the 0.618 Fibonacci Retracement area where a Dead Cat Bounce may be possible. If it keeps moving upwards, be careful with the 0.786 Fib level where there is prior resistance as well as Ichimoku Cloud and EMA ribbon resistance. If price and RSI come back for a re-test and successfully re-test the line along with Volume support, that would be bullish.
Included in the chart: Trend line, Support and Resistance Lines, RSI, MFI, Ichimoku Cloud, Volume, Fibonacci Retracement, EMA Ribbons, and Simple Moving Average.
If you enjoy my ideas, feel free to like it and drop in a comment. I love reading your comments below.
I have a bunch of additional recent charts below on cryptocurrencies to review. Check them out!
Disclosure: This is just my opinion and not any type of financial advice. I enjoy charting and discussing technical analysis. Don't trade based on my advice. Do your own research! #cryptopickk

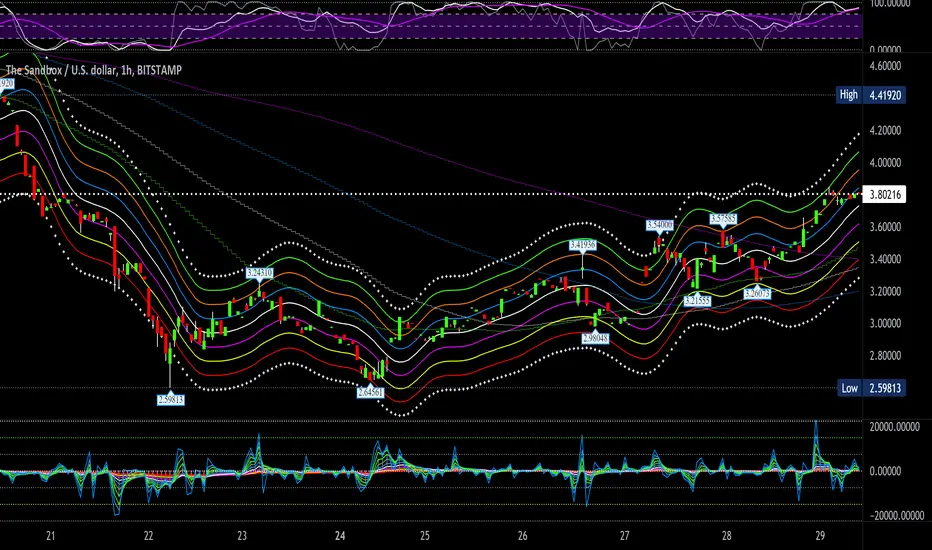
The SandboxThe Sandbox (SAND/USD) just made a bullish cross SMA55/SMA233 on 1/29 at 5am 1hr chart. It's been in an uptrend since 1/22 at 5am with a double bottom bounce on 1/24 at 5-7am. Here's levels on the 1 hour chart, 1 week view:
7 day high = $3.81
7 day low = $2.60
52 week high = $8.44
52 week low = $0.08
SMA233 = $3.40
SMA144 = $3.20
SMA89 = $3.34
SMA55 = $3.47
breakout = $4.18
R3 = $4.06
R2 = $3.95
R1 = $3.84
pivot = $3.73
S1 = $3.62
S2 = $3.50
S3 = $3.39
breakdown = $3.28
Do your own due diligence, your risk is 100% your responsibility. This is for educational and entertainment purposes only. You win some or you learn some. Consider being charitable with some of your profit to help humankind. Good luck and happy trading friends...
*3x lucky 7s of trading*
7pt Trading compass:
Price action, entry/exit
Volume average/direction
Trend, patterns, momentum
Newsworthy current events
Revenue
Earnings
Balance sheet
7 Common mistakes:
+5% portfolio trades, capital risk management
Beware of analyst's motives
Emotions & Opinions
FOMO : bad timing, the market is ruthless, be shrewd
Lack of planning & discipline
Forgetting restraint
Obdurate repetitive errors, no adaptation
7 Important tools:
Trading View app!, Brokerage UI
Accurate indicators & settings
Wide screen monitor/s
Trading log (pencil & graph paper)
Big, organized desk
Reading books, playing chess
Sorted watch-list
Checkout my indicators:
Fibonacci VIP - volume
Fibonacci MA7 - price
pi RSI - trend momentum
TTC - trend channel
AlertiT - notification
tickerTracker - MFI Oscillator
www.tradingview.com