Another Short Trade $BTC #BTCForecast Path:
The curved blue arrow indicates a projected drop in price to around $56,495.8. #BTC KRAKEN:BTCUSD
This path suggests a bearish forecast over the coming 16 days and 16 hours, potentially representing a decline of around -9.70%.

GBPUSD: Navigating Potential Temporary Bullish ObjectivesGreetings Traders,
GBPUSD is currently exhibiting bearish institutional order flow from a long-term perspective. However, there's a temporary bullish momentum as price approaches the H1 bearish order block, aiming to fill the liquidity void and reach the mitigation block. From there, we anticipate

Bitcoin May Face a Big Test SoonBitcoin has moved sideways since the end of February, and the cryptocurrency may face a big test soon.
The first pattern on today’s chart is the $69,000 peak from November 2021. Prices inched above this level in March and April but failed to hold. Traders may next view a return above the old highs

Is Tesla Poised to Hit 199.0 Again?Is Tesla set to touch the 199.0 level again? The 1-hour chart shows a retracement from the 170.0 level, and the zigzag pattern confirms a bullish continuation. Additionally, my custom RSI has given a buy signal. Let's see what happens next!

Trading Plan for Wednesday, May 8th, 2024Trading Plan for Wednesday, May 8th, 2024
Market Sentiment: Bullish, but increasingly cautious in the overbought market. Consolidation is ongoing, and a deeper pullback is likely before further advances. Maintain disciplined risk management.
Key Supports
Immediate Supports: 5209 (major), 5202,

SPX500 Potential Dip in UptrendThe SPX500 daily chart has a positivity associated with it. However, the hourly chart has pulled back to the point that is tending towards oversold. This may set up a potential "dip in the uptrend" scenario.
This video is intended for the users of Stratos Markets Limited, Stratos Trading Pty. Limi

1340 The Bitcoin ProphecyThis is about an authentic Bitcoin halving index.
We place the prices between the halving dates at a common starting point. But what makes this index more credible? I’ve seen many similar indexes, but none of them were properly constructed. Satoshi Nakamoto mined the genesis block on January 3, 20

PSX Pakistan StockThis Chart is printing a Bullish trend and their is no divergence in RSI Indicator .This chart is called a Bullish Cup and Handle
Entry Point Buy Stop:11.43
Stop Loss:10.68
Number of Shares:1333.333
TP1:12.22
TP2:12.98

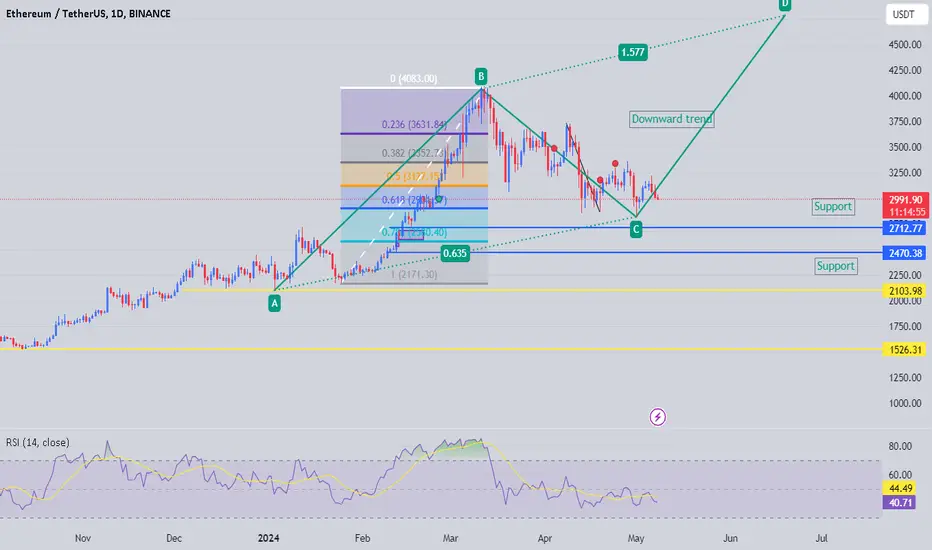
ETH-USDT Buy Setup using ADCD and Bullish Flag patternEthereum looks bearish for short period of time. The price will retrace in between .61 and .71 fib level.
Its also forming a bearish continuous flag pattern and there is no divergence in short time frame..
In a longer run I am still bullish its forming a nice bullish flag and can break an all time
USD/JPY – Yen weakness prompts warning from TokyoThe Japanese yen is down for a third straight day and has declined 1.5% this week. USD/JPY has risen 0.43% on the day and is trading at 155.35 at the time of writing. Early Thursday, the BoJ will release the Summary of Opinions from the April meeting.
Japanese officials remain mum about suspected i

See all ideas