Bull FlagContinuation of Uptrend
Wait for breakout
Always manage your risk according to your portfolio and also do your own analysis before taking any trade.
Please give your suggestions in comment section so i can improve my skills.
Thank you
PENDLEUSDT trade ideas

#PENDLE/USDT is heading towards a retest of the diagonal Trendli#PENDLE/USDT is heading towards a retest of the diagonal Trendline in 4-Hour TF!
I'm expecting liquidity below this trendline and then a pump. SEED_DONKEYDAN_MARKET_CAP:PENDLE breaking PMH $5.43 support level. Wait for Breakdown and Reclaim to add some in the spot.

PENDLEUSDT.4HThe 4-hour chart for Pendle (PENDLE/USDT) indicates a consolidation pattern, where the price is compressing within a symmetrical triangle. This pattern typically suggests a continuation of the prior trend, which in this case has been upward.
The price is currently trading near $6.053. The first resistance (R1) is marked by the upper trendline of the triangle, while a more significant resistance (R2) is at $7.545. The primary support level (S1) is the lower trendline of the triangle at around $5.462, with a secondary support (S2) being the previous low around the $1.604 mark.
The RSI is moderately neutral at 54.42, suggesting there’s room for a move in either direction. The MACD is close to the signal line but slightly above, indicating potential for bullish momentum.
As the price approaches the apex of the triangle, a breakout in either direction could signify the next strong move. A break above the triangle could target R2, while a breakdown below could see a move towards S2. Trading strategies might include waiting for a confirmed breakout with volume for direction.

PENDLEUSDT 4HSymmetrical triangle formation on #PENDLE 4H timeframe. Looks promising and ready for the breakout. Wait for the breakout and then enter. Targets are:
$6.894
$7.510
$8.126
$9.003
$10.121
Support: $6.132

Pendle bull flagPendle has been a market leader and has shown some alpha, the token has pumped on its own against the market at times. This looks like a multi day bull flag setup, you could also draw this as a contracting wedge. A completely reset stochastic is important here as well, this flag projection is over 9$. Any time the stochastic has dropped significantly below 20 the token has gone on an absolute tear.
-Id love another test of 7$ in the next 2 days to confirm this flag
-After this my long-term price target of 8-10$ will be realized

PENDLE/USDT Keep an eye on the demand and support area!💎 Paradisers, the recent market dynamics surrounding #PENDLE have indeed been noteworthy.
💎 Experiencing rejection once more at the strong resistance area, PENDLE has retraced back downward, potentially targeting the demand zone between 5.16 and 4.67.
💎 If PENDLE reaches the demand zone, it will be crucial for it to bounce back and attempt to break above the resistance trendline to resume its upward trajectory and test our target strong resistance area.
💎 However, if PENDLE fails to find support at the demand area and even breaks below it, the next likely target will be the key support area. This area presents a favorable buying opportunity for PENDLE, as a bounce from this zone could signal a continuation of the bullish movement.
MyCryptoParadise
iFeel the success🌴

[PENDLEUSDT] - [Perpetual Contract] Short Trade [Trade #]Bias: Short
Reason: 12HS MSB. Entry on bearish retest.
Confluence:: -
TimeFrame: 12HS
Entry, SL, Target: : On chart

PENDLEUSDT 7%.PENDLEUSDT FIBONACCI WITH FAIRVALUEGAP TRADE. PENDLEUSDT in top gainers in last 4 hours on no 5.

Pendle LongCross chain decentralized finance protocol that allows users to tokenize and sell future yields. The chart has been holding up relatively nice in the face of selling pressure.
Buying the dip at 5.6

Pendle boomThis coin will make you rich in notime
!!!
Daily growth more than 30percent insane numbers huge cap
Possible hourly support bouncePlain and simple, an hourly support bounce makes for many trades available on lower timeframes.

Pendle crushingPendle continues to exceed expectations. For those who do not know my Pendle was unfortunately drained a week ago and I lost my entire bag (never has happened to me before). I will continue to cover this amazing token as it is still one of my favorite projects in all of crypto. If I ever see another entry Like we saw on that 2.5$ dip I will re-enter.
-My price target and would have been profit take is still 8$, for those who have been following that is a fair starting point for an exit
-I think we are about to see a push to the golden fib extension given the momentum we are seing

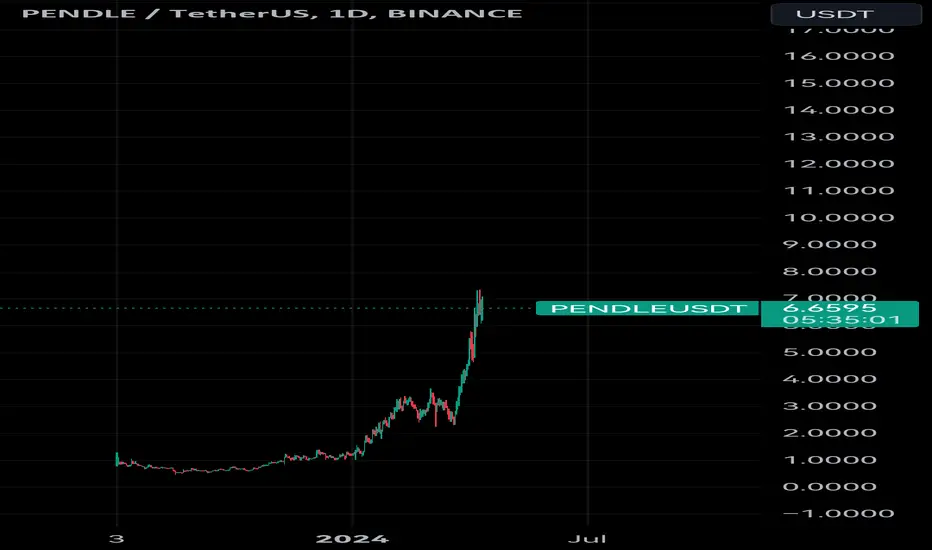
Pendle will the rally Continue?PendleUSDT, the token associated with the Pendle decentralized options protocol, has been on a remarkable run since its launch in September 2023. After breaking through a key resistance level of $3.35 per token, it's currently trading at $7.17 . Analysts are now left wondering: where will this growth stop?
A potential short-term peak at $8.10 before a pullback towards the established support zone of $3.35 . This pullback wouldn't necessarily negate the overall bullish trend, as the $3.35 level represents a strong demand zone where buyers are likely to step back in.

Pendle moving up?Recevied a buy print in Pendle and we are waiting for more volume. Can this do another YGG. Let's wait and watch. Stop loss below our green line.

Pendle Sell SeupPENDLE can have correction this bullish leg, this can be profitable Short Setup with low risk

pendlSupport and press the rocket to cheer me up
Observe the ten percent loss limit
Stay away from Bitcoins
Feel free to buy and sell and post your comments

Pendle chartThis is done using an experimental method that I teach. This is not financial advice. Ideally is the price to keep diagonal support and go above heavy resistance. The heavy resistance is the one that dictates if the price will go up or down.

PENDLE BREAK TO UP $5 HIGH POSSIBLITYPENDLE showing on cycle trend important data for the high possibility to increase to up $5 in the coming time frames.
we will follow this to see if it can get confirmed.
The last data of this coin shows a high interest in the break trend.
Next time frames could be very important for the trend.

Pendle hit targetPendle broke out and hit my first target rather quickly. Next stop is just over 5$. I expect this 5$ zone to hit very quickly with the arbitrum hype and liquidity rushing in. My post about consolidation was the time to get in if you had wanted, we are in price discovery again, the sky is the limit.

Staking maniaThere has been a correction in ETH, but the Restaking ETH is still hot. As the leading protocol in this sector, Ether.fi has increased by more than 200% after listing. In addition to the Restaking protocol, the yield swap protocol Pendle has also attracted much attention during this period.
Today we take a look at Pendle’s recent performance. Pendle provides the crypto with a yield swap market, splitting financial products into PT (principal) and YT (potential return part) to meet the needs of different traders with the opportunity to add leverage trading to potential returns. For example, if you think that the interest rate for borrowing USDC will be higher and higher in the subsequent period, then you can purchase YT-aUSDC (USDC interest rate on AAVE) in pendle, which is a process of increasing leverage. , if your judgment is accurate, you will get several times the rate of return than directly lending USDC on AAVE.
In the current environment where various types of staking points are frequent, Pendle has split the PT (principal) and YT (the part of earning points) of Restaking and Staking. Punters who are inclined to expect airdrops can use nearly 10 times the leverage to participate. In the staking activities, PT also provides traders with low risk appetite with an ETH-based return of nearly 30%. Based on the above advantages, Pendle also surpassed GMX and became the native protocol with the highest TVL and highest MC on Arbitrum.
In terms of the use of indicators, we see that Pendle’s trend is relatively simple and clear. At the 4h level, the TSB indicator prompted a SELL signal on March 11. After that, pendle experienced a correction that lasted several days. On March 22, TSB prompted a BUY signal, and Pendle resumed its rise, and break ATH. In both processes, the wavy area plays the role of providing resistance and support.
Judging from the TSB indicator, Pendle’s bulls are currently healthy. Fundamentally, Pendle has the hottest narrative.
Introduction to indicators:
Trend Sentinel Barrier (TSB) is a trend indicator, using AI algorithm to calculate the cumulative trading volume of bulls and bears, identify trend direction and opportunities, and calculate short-term average cost in combination with changes of turnover ratio in multi-period trends, so as to grasp the profit from the trend more effectively without being cheated.
KDMM (KD Momentum Matrix) is not only a momentum indicator, but also a short-term indicator. It divides the movement of the candle into long and short term trends, as well as bullish and bearish momentum. It identifies the points where the bullish and bearish momentum increases and weakens, and effectively capture profits.
Disclaimer: Nothing in the script constitutes investment advice. The script objectively expounded the market situation and should not be construed as an offer to sell or an invitation to buy any cryptocurrencies.
Any decisions made based on the information contained in the script are your sole responsibility. Any investments made or to be made shall be with your independent analyses based on your financial situation and objectives.

PENDLE NEW INCREASE VOLUMEPENDLE shows a new increase in volume, which could be confirmed in the coming time frames.
We will follow the coin to see if it's able to confirm.
The reason for the volume is the trend data that this coin shows.
This coin is at basic choice on daily trends.

pendleusdtSupport and press the rocket to cheer me up
Observe the ten percent loss limit
Stay away from Bitcoins
Feel free to buy and sell and post your comments

Pendle breaks consolidationPendle looks to be breaking the consolidation zone that I expected to take up to 60 days a bit early here. I am unsure if this is leverage or that fact that the team has been literally killing it lately. Pendle is now on 5 blockchains, they have a trading app, the bond type products and LPs. My two near term targets are marked with dash greens. Since we are in price discovery its hard to say how high we go, last breakout was a huge move over several weeks.
