Long-term position in Home Depot Inc $HDThis week, I entered a long-term position in Home Depot Inc NYSE:HD
Timeframe: M
SL: ~$302
Target: ~$550
HD trade ideas

HD channelHD is one of my current core holdings that I averaged into during the crash last year. I have always liked the company fundamentally, and even have had success trading options on the stock as well. HD is above the golden fib (strong momentum) and has risen despite market turmoil. Even though tech is the favored sector right now HD has continued to rise. There simply is a shortage of housing in America, Warren Buffett is bullish on home builds, HD indirectly benefits from this since its the main source of products for new homes. If HD stays in the channel I believe we see 400$ in Q2. I also believe people will slowly flock to value this year as they realize that the Mag 7 are clearly overvalued.

HD: Finally Patterning Out Post-PandemicNYSE:HD benefited greatly from the pandemic lockdown and the numerous stimulus checks that over-stimulated all nations' economies.
The stock has now moved above its trading range and has sustained, aka held onto, those gains.
This patterns out the excessive revenues and earnings that were inevitably unsustainable for all of the companies that benefited from the brief surge of revenues due to the "over-stimulus checks."
This is the Weekly Chart to show that the Year over Year comparatives that harmed HD for a couple of years is now patterned out.

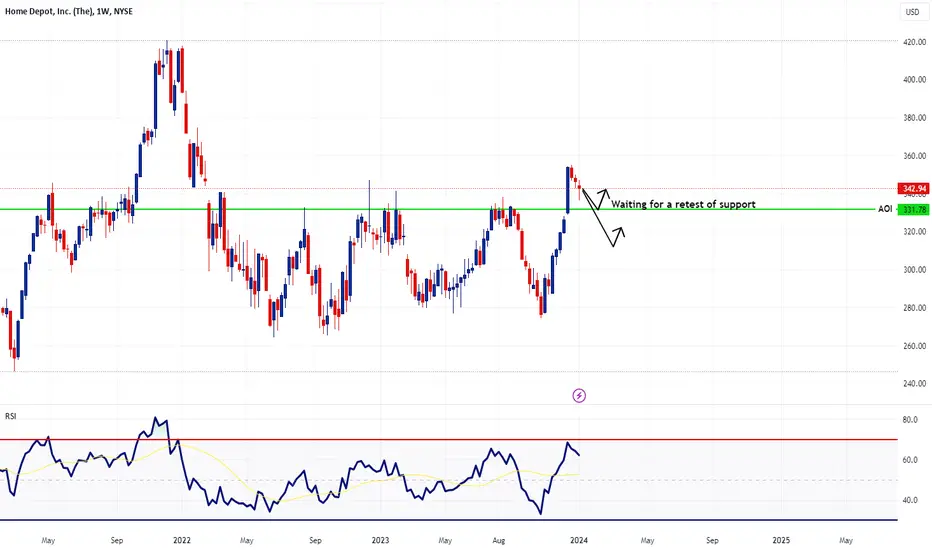
HD - Waiting for Retest of SupportWeekly timeframe shows that this stock is likely to pullback to my level of support highlighted on the chart.
I need that level to be tested before deciding on what to do with this stock. If we reach that level, I'll assess market conditions and momentum to determine if it's a low risk entry. There might be a chance of further declines as shown with my second arrow.
Home Depot: Technical Outlook Breaking through the duplicated trend line indicating very bullish momentum. Likely to retreat back to the rising channel. Currently in a flag pattern on a 1h chart. Areas plotted to look out for, combined with daily and weekly moving averages to be used as S/R confluences. Analyst target at 356 USD.

Home Depot a Long Term Buy and HoldHome Depot began in 1982 at $0.03 per share. Imagine buying $1,000 of NYSE:HD in 1982, which is now 334,000 shares, which is worth $118M and pays you $2.8M per year in dividends.
Home Depot opened up the first store in 1979 and IPOed in 1981 at $12 a share. It then with all the splits averaged to $0.03 a share.
This stock is up 1,000,000% since IPO.
Wild ride that is far from over. If you look at the trend, it is still bullish and setting up to make new highs soon.
In the last 12 months, operating cash flow was $21.03 billion and capital expenditures -$3.27 billion, giving a free cash flow of $17.76 billion for $HD. This stock pays an annual dividend of $8.36, which amounts to a dividend yield of 2.36%. The stock price has increased by +8.06% in the last 52 weeks. The beta is 0.94, so The Home Depot's price volatility has been similar to the market average.
The Home Depot has a market cap or net worth of $352.32 billion. The enterprise value is $399.52 billion.
Return on equity (ROE) is 1,339.60% and return on invested capital (ROIC) is 33.57%.
The stock's EV/EBITDA ratio is 15.68, with an EV/FCF ratio of 22.49.
This stock is a company where employee turn over is low and customers keep returning. They know their business and keep growing. The trend is still rising from the left side of the chart to the right. Invest well and build your forever income.

HD attempts breakoutHD is one of my core fundamental holdings that I averaged into during this market crash last winter. The stock has been ranging between these two blue horizontal lines. There appears to be enough momentum to breakout here and I am definitely still long on the holding. My target short term is 347$ to fill the gap.

Home Depot, Inc. (The)Weekly chart with ichimoku in MTF.
Two important resistances with the monthly kinjun.
RSI at 62.23 and MACD heading north.
Make up your mind.

HD Expectations (FLAG)Home Depot (HD) exhibits several bullish indicators that suggest a potential upward trajectory. Firstly, the company consistently demonstrates robust financial performance, with strong revenue growth driven by increased consumer spending on home improvement. Additionally, HD's market dominance, extensive store network, and successful online presence position it favorably to capitalize on evolving consumer trends.
Furthermore, the housing market's resilience and ongoing demand for home improvement projects, coupled with the company's proactive strategies in adapting to changing consumer preferences, create a favorable environment for HD's continued growth. Analysts' positive sentiment, coupled with the company's solid fundamentals, make a compelling case for a potential upward trend in HD's stock price.

HD breaking channelHD breaks out of the channel on bullish CPI news and positive earnings. I simply hold HD long-term and buy it whenever it reaches about 280$.

Home Depot set for VolatilityHome Depot Traders Prepare for Earnings Results Today; EPS of 3.82 Expected
Yesterday, Home Depot's stock (HD) experienced bearish price action, causing it to fall as low as 287.24 before stabilizing at 288.07. This consolidation of losses comes after 4.55 million shares were traded on the day, surpassing the multiday average of 3 million.
Today, Home Depot is expected to report earnings per share (EPS) of 3.82 and revenue of $35.66 billion. Traders and investors will be closely watching these results to assess the company's performance.
Key Facts about Home Depot
Over the past 5 days, Home Depot's stock price has dropped.
Home Depot has underperformed the Dow by 0.01% so far this year.
The stock currently has a market cap of $288 billion.
Yesterday's market volume for Home Depot was 4.55 million shares, which is 151% higher than the average.
It appears that Home Depot's price action is currently pivoting around key support at 286.9. If this level succumbs to bearish pressure, the next support level to watch out for is at 285.72.
With today's 1.21% drop to 288.07, Home Depot's ongoing four-day downtrend has been further accentuated. Yesterday, the bearish market action caused Home Depot to dip to 287.24 before settling at $288.07, consolidating its losses and securing market bears' dominance.
Key Points:
Home Depot's price action is currently pivoting around $286.9, which is a key support level.
The next key support level to watch out for is at $285.72.
If Home Depot dips below $283.03, it could indicate further losses are ahead.
On the other hand, if it fails to break below this level, it may be seen positively by market bulls and a retracement could be on the cards.
The next downside barriers for Home Depot are at 286.9 and 285.72.

HomeDepot HD BUY SIGNALBuy Signal at my indicator.
MACD crossing up
Green bars at hologram
MA 10 crossing 20
MA 200

HOME DEPOT Stock Chart Fibonacci Analysis 103023 Trading Idea
1) Find a FIBO slingshot
2) Check FIBO 61.80% level
3) Entry Point > 277/61.80%
Chart time frame : B
A) 15 min(1W-3M)
B) 1 hr(3M-6M)
C) 4 hr(6M-1year)
D) 1 day(1-3years)
Stock progress : C
A) Keep rising over 61.80% resistance
B) 61.80% resistance
C) Hit the bottom
D) Hit the top
Stocks rise as they rise from support and fall from resistance. Our goal is to find a low support point and enter. It can be referred to as buying at the pullback point. The pullback point can be found with a Fibonacci extension of 61.80%. This is a step to find entry level. 1) Find a triangle (Fibonacci Speed Fan Line) that connects the high (resistance) and low (support) points of the stock in progress, where it is continuously expressed as a Slingshot, 2) and create a Fibonacci extension level for the first rising wave from the start point of slingshot pattern.
When the current price goes over 61.80% level , that can be a good entry point, especially if the SMA 100 and 200 curves are gathered together at 61.80%, it is a very good entry point.
As a great help, tradingview provide these Fibonacci speed fan lines and extension levels with ease. So if you use the Fibonacci fan line, the extension level, and the SMA 100/200 curve well, you can find an entry point for the stock market. At least you have to enter at this low point to avoid trading failure, and if you are skilled at entering this low point, with fibonacci6180 technique, your reading skill to chart will be greatly improved.
If you want to do day trading, please set the time frame to 5 minutes or 15 minutes, and you will see many of the low point of rising stocks.
If want to prefer long term range trading, you can set the time frame to 1 hr or 1 day.

Long term view of the HD dca zoomed out view of the prior post, purple long term resistance is holding and we see a converging horizontal, reversing rsi, and bounce towards the teal level.

HD looking to bounce on supportive intersectionHD looking to bounce on a tripe intersection of multiple support types. RSI may be reversing here, I am not trading this short-term but may use this area to add to long-term spot

HD update struggling to find supportHD is one of my long-term holds that I do not plan to sell for a decade or more. The stock rallied earlier this year but has been in free fall with questionable economic conditions. Wtih Warren Buffet buying heavily into home builders HD should eventually catch on to this trend as more materials are needed in the coming years. TA wise, HD is looking to bounce around the green line it approaches.

HD BUY++++ and add any weaknessHD has strong support around $281 and is oversold here on several indicators first target is $297 and as high as $319 second target in coming weeks

📈📊 #ChartPattern Alert! 📈📊 📈 Channel 📈A "channel," in the context of trading and technical analysis, is a chart pattern that forms when the prices of a financial asset move between two parallel lines, creating a kind of corridor or channel. There are two main types of channels: an ascending channel and a descending channel.
Ascending Channel: This channel forms when prices have an overall upward trend, but this trend is contained within two upward-sloping parallel lines. The lower level is the support, where prices often find buyers, while the upper level is the resistance, where sellers may come into play. Traders often view the ascending channel as a sign of the continuation of the existing uptrend.
Descending Channel: On the other hand, the descending channel forms when prices have a downward trend, but this trend is bounded by two downward-sloping parallel lines. The upper level is the resistance, where prices tend to retreat, while the lower level is the support, where minor bounces may occur. Traders typically interpret the descending channel as a sign of the continuation of the downtrend.
Channel analysis is an important tool for traders as it can help identify entry and exit points, as well as set profit targets and stop-loss levels. However, it's crucial to note that channels are not foolproof, and prices can break beyond the channel lines, signaling a change in trend.
In summary, a "channel" is a chart formation that depicts the direction and strength of a price trend in a financial asset. It's a useful tool for traders looking to make informed decisions about their market trades.

$HD buying opportunityNYSE:HD has been consistently staying above a few solid supports while remaining underbought, presenting a buying opportunity. Although the current decline in the housing industry is holding it down, the stock is looking promising from a technical standpoint at the moment.

HD climbing back to support after selloffHD is another long-term hold for me that went into a buy zone over the past few days.

HOME DEPOT Close to start forming the long-term bottom.Home Depot (HD) is near the Higher Lows trend-line of the 12-month Triangle pattern. Even though it's already on an excellent buy level, the distinc characteristic of the previous two bottoms has been an inner Higher Lows formation. That was the final Low before rising and never seeing such low levels again.
On top of that, the 1D RSI is remarkably oversold (even touched 20.00 at some point), so we already have a bullish opportunity at hand. Our target is the 0.786 Fibonacci level at 326.50.
-------------------------------------------------------------------------------
** Please LIKE 👍, FOLLOW ✅, SHARE 🙌 and COMMENT ✍ if you enjoy this idea! Also share your ideas and charts in the comments section below! This is best way to keep it relevant, support us, keep the content here free and allow the idea to reach as many people as possible. **
-------------------------------------------------------------------------------
💸💸💸💸💸💸
👇 👇 👇 👇 👇 👇

Island reversal pattern forming for Home Depot?Island reversal pattern forming for Home Depot NYSE:HD ?
Started in Feb 22 almost a year ago after earnings report.
If it completes, exceeding 339, then it will be a bullish reversal and 400-420 will be in play. So for next earnings it's possible that price will gap higher. Still watching though.
This is not advice. Do your own research and trade your own plan!!

Key support and resistance areasLots of bottoms, many volume. Just my two cents.
Range around 295 to 328
