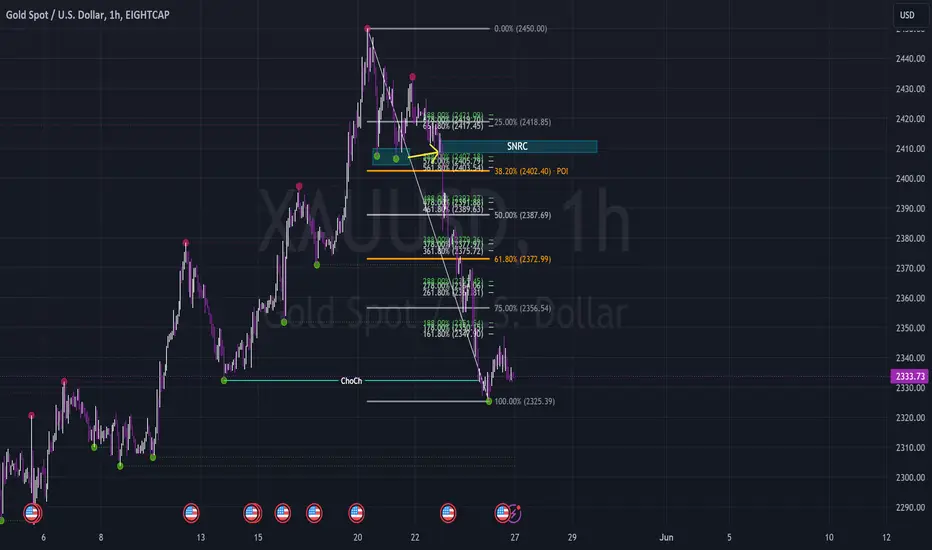
H1 XAUUSD Bearish TrendThe H1 pattern already made bearish Choch in 1-hour time frame. My analysis, XAUUSD will make pullback to 2410 before continuing its bearish trend. This is my preliminary analysis until 2347 inducement level has succeeded to be broken by bullish body break
GOLD trade ideas

XAU/USD 23 May 2024 Intraday AnalysisH4 Analysis:
-> Swing: Bullish.
-> Internal: Bullish.
Price has printed a bullish BOS.
After bullish BOS, expectation is for price to pullback.
As previously mentioned, price was showing very early signs of pullback, however, we did not have indication or confirmation.
I also previously mentioned that first indication, but not confirmation, would be for price to print a bearish CHoCH. The CHoCH line is denoted with a blue dotted line.
Price has now printed a bearish CHoCH which indicates, but not confirms pullback initiation.
Price is now in discount of 50% EQ and close to a H4 demand zone where would expect to see a reaction.
Intraday expectation: Price to continue bearish and react at H4 POI's to then target weak internal high which is denoted with a blue dashed line.
H4 Chart:
M15 Analysis:
-> Swing: Bullish.
-> Internal: Bearish.
Price has printed a bearish iBOS (Internal break of structure).
After iBOS price is expected to pull back.
Intraday expectation dated 21 May 2024 was for price to continue bullish. React at either premium of 50% EQ or M15 POI both of which were positioned closely before targeting weak internal low which was denoted with a blue dashed line.
Price printed as expected and printed a bearish iBOS.
Price has continued bearish and we are now trading within an internal high and fractal low.
Intraday expectation: We are expecting price to pullback. First indication, but not confirmation of pullback initiation is a bullish CHoCH which is denoted with a blue dotted line. Price to continue bullish, react at premium of 50% before targeting weak internal low which is currently a fractal low.
M15 Chart:

XAUUSD:Long first, then short
Gold continues to fall. It has dropped nearly 60$ from 2410 to now. The current main support is around 2352. The trading is long first and then short. On the rebound, focus on the resistance near 2378.
There is data today, please pay attention to risk control when trading during U.S. market time. Friends who want to follow my trading data, please contact me in advance.

Long XAUUSDTake trade on your own risk!
Verse of the day 1 Peter 5:6
Take profit: 2408
Stop Loss: 2332

Gold relatively deep pullback..watchlisting it..Hello fellow traders , my regular and new friends!
Welcome and thanks for dropping by my post.
Watching gold for it to hold the level. quite a deep pullback of 5%. Let's see how it hold out. If it holds I think i would prefer a long on Silver USD instead. Let's see how it plays out.
Do check out my recorded video (in trading ideas) for the week to have more explanation in place.
Do Like and Boost if you have learnt something and enjoyed the content, thank you!
-- Get the right tools and an experienced Guide, you WILL navigate your way out of this "Dangerous Jungle"! --
*********************************************************************
Disclaimers:
The analysis shared through this channel are purely for educational and entertainment purposes only. They are by no means professional advice for individual/s to enter trades for investment or trading purposes.
*********************************************************************

The most comprehensive gold analysisIn the U.S. market on Tuesday (May 28), spot gold fluctuated within a narrow range and is currently trading around $2,355 per ounce. Gold prices rebounded nearly 1% on Monday, hitting an intraday high of $2,358.40 per ounce and closing near $2,350.99 per ounce, as investors assessed reduced bets on U.S. interest rate cuts ahead of a key inflation report later this week. Most U.S. markets are closed for the Memorial Day federal holiday. The price of gold hit a record high of US$2,449.89 last week, but has since fallen by more than US$100. It hit a low of US$2,325.28 per ounce last Friday, and then rebounded in shock. Minutes of the Fed's latest policy meeting, released last week, showed officials believed it could take longer than previously thought for inflation to fall to 2%. Investors are currently awaiting data on the U.S. personal consumption expenditures (PCE) price index for April, due to be released on Friday, which is the inflation gauge favored by the Federal Reserve. Gold rose as demand for the precious metal rose. The RSI is at medium levels, so there is plenty of room to gain additional upside momentum. If gold stabilizes above $2,350/oz, it will head towards the next level of resistance, which lies between $2,390/oz and $2,400/oz. Gold prices rose on Monday, on the one hand due to the weakening of the U.S. dollar index, and on the other hand, the geopolitical situation in the Middle East boosted safe-haven buying. There are few economic data on this trading day. Pay attention to the U.S. Conference Board Consumer Confidence Index in May. In addition, you need to continue to pay attention to the speeches of Federal Reserve officials and news related to the geopolitical situation in the Middle East.

XAUUSDHello friends, I see a continuing pattern on gold, I think we should go down another path
2318 I think it should be touched
Now gold is 2345

XAUUSD:28/5 Today’s Analysis and StrategyGold technical analysis
Daily resistance is 2370, support below is 2327
Four-hour resistance is 2370, support below is 2327
Gold operation advice: Yesterday, the overall price of gold stabilized above 2330 in the short term. However, the current hourly line and 4-hour chart are still in the downward rhythm of short pressure. The 4-hour level still sees a suppressed and volatile operating rhythm until it reaches the 2400-point integer mark.
Judging from the current trend, today's short-term pressure will focus on 2370. During the day, counterattacks will rely on this position to be bearish. The short-term support below will focus on around 2340. Today, the overall focus will be on selling high and buying low in the 2340-2370 area, and trade cautiously in the middle position.
SELL:2370near
SELL:2360near
BUY: 2340near
Technical analysis only provides trading direction!

XAUUSD LONGSeing Great Long idea on XAUUSD after nice drop which gives us quite nice entry price with a good Risk Reward

Gold ''Short" termGold has shown signs of momentum changing to the downside for the time being. The higher time frames suggest so. I have taken short position to the downside.


Trading strategy today, downtrendKitco News' latest gold survey shows more than three-quarters of industry experts believe gold prices have stabilized or will fall next week. Meanwhile, half of retail traders polled still believe the precious metal could move higher in the coming days.
ActivTrades senior analyst Ricardo Evangelista said that information in the Fed's meeting minutes has caused traders to push back the expected interest rate cut from September to November. This change has helped push Treasury yields and the USD higher and put pressure on precious metals.
Market strategist Colin Cieszynski of SIA Wealth Management is neutral on gold this week. He said that the gold market will be quiet this week without important events.
Reports released this week include: Consumer confidence report, preliminary report on GDP in the first quarter of the US, weekly unemployment benefit applications, pending home sales, Personal consumption expenditure reports along with personal income reports in the US

Gold dropped sharply as the FED continued to be hawkishA bad home sales report (but record April home prices) combined with falling traffic and smaller spending data from Target cast an early shadow on the markets but it was the FOMC Minutes that did the trick. big waves with their more hawkish comments.
For any and all that say "yeah but they're old, we've had CPI and Retail Sales since then", see the chart below to find growth macro data disappointing since the last FOMC meeting and the development of the data matrix continues to increase - not stopping at the state of testing the technical summary...
The gold market remained unchanged before the FED meeting. However, in the Asian session, there was a very deep decline to the resistance area of 2342 - 2338.
Currently, it is calming above the 2360 level
But with these moves, we have the possibility that gold could fall further again

Gold Weekly Summary and Prediction May 25, 2024
This was what I predicted on May 4, 2024. The overall trend predicted was correct but weekly close was larger than what I thought.
This week didn't reach my prediction of 2470 but only 2450. I have engaged selling at 2432 and still holding.
Next week will be massive fall for Gold. But there could be two scenarios as illustrated above.
Which one do you think is more likely to happen?
I will let you know my favor tomorrow.

🆕 XAUUSD: Curve Analysis 🆕Based on the 4H Chart
SLO2 @ 2441 📉
SLO1 @ 2424 ⏳
TP1 @ 2391
TP2 @ 2363
TP3 @ 2343
TP4 @ 2311
BLO1 @ 2304 ⏳
BLO2 @ 2285 ⏳
This is an Intermediate Time Frame trade (4 hours to 6 day):
— Offers a clearer picture of the underlying trend compared to short-term frames.
— Provides more opportunities for confirmation signals and technical analysis.
— Allows for more flexible trading schedules, trades can be held overnight.
— Suitable for swing traders and some positional traders.
🔑
⏳ = PENDING ORDERS
BLO = BUY LIMIT ORDER
SLO = SELL LIMIT ORDER
SSO = SELL STOP ORDER
TP = TAKE PROFIT

Gold in pullbackMore volatility coming in. If you can catch a pullback in M1. I think its about to break the floor


GOLD NEXT MOVE TO 2390GOLD NEXT STOP TO 22390
ITS STRUSTURE SHIFTED AND RESPECTED OB and now its journey is upto where its bear breaking was started
also on 1D it respected OB

Daily live trade with XAUUSD in 15m/30m/1h 20240528Daily live trade with XAUUSD in 15m/30m/1h 20240528

Positive trend with goldWorld gold charges generally tend to growth with spot gold growing with the aid of using 2.four USD as compared to ultimate week`s final level
Looking at gold's fluctuations ultimate week, marketplace analysts stated that gold is in all likelihood to lower this week. The motive gold set a document excessive early ultimate week at 2,450 USD/ounce become because of the marketplace. reacting to statistics associated with the coincidence that claimed the lifestyles of the President of Iran. However, the energy of the USD brought on gold to be offered off and plummet to almost 2,three hundred USD/ounce.
In addition, the lower in call for for gold from Chinese buyers is likewise an adverse issue for this valuable metal.

XAUUSD May 27, 2024 gold's reaction after a sharp declineWith investors' expectations of interest rate cuts in the market increasingly decreasing, especially when statements from Fed members last week all hinted that there will be no plans to cut interest rates in the near future. This interest rate causes the expectation to buy gold to decrease, leading to a weak demand for accessing the market.
Looking at H1 last weekend, we witnessed a strong decline according to the Elliot wave principle. This strong decline may be a characteristic of wave 3 of wave c in the abc correction wave as shown on the chart.
- Currently the price is in a recovery phase and this could be wave 4. We measure the target of wave 4 ending at the price range 2351-2355
- Then the price continues to decrease to complete wave 5 as well as wave c, then we have the target price area of this wave 5 at 2322.7 or 2311.5
Trading plan
- We can sell at area 2351-2355 when candlestick reversal signals appear in this area.
- We can buy in 2 areas 2322.7 and 2311.5 when candlestick reversal signals appear in this area
Note: Sufficient TP, SL to be safe and win the market‼ ️Change data plan will be updated later.
Deekop's analysis is only a personal opinion with a desire to share its views with the community. I'm not always right. But my analysis always reflects my meticulous evaluation of what is best for an investment.
