GOLD trade ideas

GOLD (XAU/USD): what does the MTF view orchestrate?Initially, taking a look at the Monthly-timeframe development, it could be noted that the price is printing huge wick candles, which emphasises the inability to continue pushing in the upside destination. Identifying all crucial key zones and levels of decision, we may point out the importance of the 2.07 key region, the borders of which could be visited in the upcoming middle to long run if our game-plan plays out as desired.
Zooming into the Weekly-timeframe chart to locate probable entry areas, the right shoulder zone of the currently forming Head&Shoulders pattern could be held under the radar. If the price manages to bounce off the neckline highlighted on the graph and reach the right shoulder zone as orchestrated, we might look into taking short positions and aim for the 2.07 destination in the upcoming long run.

Today's trading strategy, sell XAUUSDWorld gold prices increased slightly with spot gold increasing by 5.7 USD to 2,342.6 USD/ounce. Gold futures last traded at 2,364.5 USD/ounce, up 27.6 USD compared to yesterday morning.
Gold prices reversed to increase after the latest published data showed that economic growth in the US has slowed down from the beginning of the year until now. According to preliminary data on first quarter GDP released by the US Bureau of Economic Analysis on May 30 (US time), the US economy achieved growth of 1.3% in the first 3 months of the year, lower than the previous quarter. The previous forecast was 1.6% and down from 3.4% reported in the fourth quarter of 2023. Both the dollar and Treasury yields fell on expectations the US Federal Reserve (Fed) will cut interest rates this year increased after the report.
ActivTrades senior analyst Ricardo Evangelista said that recently, traders' views have increasingly favored the scenario that the Fed will keep interest rates higher for longer, increasing the opportunity cost of holdings of the yellow metal and creating strong price resistance.
However, this expert said that gold has benefited from strong safe-haven demand due to fears of geopolitical instability and economic instability, as well as large state purchases. He hopes that these factors will likely continue in the near future.

XAUUSD recent updatexauusd is moving so deep down after various FED talks
Gold slumps amid strong US Dollar, high US Treasury yields
Gold prices slump on Wednesday amid rising US Treasury yields, boosting demand for the Greenback due to hawkish comments by a Federal Reserve (Fed) official.
our recent analysis founds 2330-2328 is a strong support area and 2344 act as major pivot due to simple moving average passing through the point and mayor retracement from that area many times yesterday.
above 2344 its a buy
like share subscribe

Gold Bear MoveGold looks like it wants to break the 200 ema. I see it bouncing off resistance once more and braking that 200 ema for the third touch for a bear play. What do you guys think. I'm newer to forex so any tips would help.

CHART BREAKDOWN XAUUSD: Key Levels, Targets and Thoughts!Brief Description🖊️:
The chart provides insights into critical market levels, emphasizing an essential supply/demand zone (low-risk sell/buy zone) spanning from 2357 to 2359 and 2331.5 to 2329.5, respectively, are highlighted.
Things I Have Seen👀:
Important Supply Zone🟢: Identified between 2357 and 2359, serving as a low-risk sell.
Important Demand Zone🟢: Identified between 2331.5 and 2329.5, serving as a low-risk buy.
Bullish Targets📈:
2335: Possible retracement area.
2347: Possible retracement area.
2356: Possible retracement area.
2364: Significant supply zone.
Ultimate Target: 2400- Significant supply zone.
Bearish Targets📉:
2356: Possible retracement area.
2347: Possible retracement area.
2340: Possible retracement area.
2333- Laying Low Liquidity
Ultimate Target: 2331: Essential Demand Zone
What's Important Now❗
Currently, the crucial approach is to wait and observe the price action at this level. We need to assess how the market reacts before considering any decisive moves. Stay observant and responsive to real-time developments in the market.

Gold bearish 2276Hey there on 4hTF the Gold has looking for continuing trying to drop down from 2300 level
So we are looking forward again drop liquidity
And also breakout candle looking for move sell side
XAUUSDOANDA:XAUUSD
XAUUSD UPDATE
📊 Gold Spot Trading Analysis 📊
Patience is key! Wait for the price to reach the supply or demand zones for larger swing trades.
Catching trades at these levels can lead to more significant profits.

XAU/USD PREPARING TO SHORTXAU/USD 1H - As you can see price has traded perfectly into an area of Supply I had marked out that I wanted to see price reject from. This is an area of Supply we could look to trade this market short from.
In order for us to get an entry now, all we need to do is look for a small pullback into a fractal area of supply giving us a more refined entry on this market. We will find this within the most recent bearish move to the downside.
When it comes to placing our short we will need to see price trade into this fractal area of Supply and reject well, from there we can look to place our SL above the zone we enter from and our TP just above the area of Demand.
If you wanted a less refined entry you could have looked to place a short position in or around the area of Supply provided with your SL above that zone and TP down at the area of Demand. Your Entry all depends on how aggressive your approach is.

XAUUSD- Gold price cannot cool down in the short termGOLD nowadays is going for walks above the 235x zone. With this rhythm, on body D1, I see that the candles are going for walks absolutely above the MA. In addition, as on Zoom final night, I additionally stated that Gold will without difficulty react barely with the parallel resistance location at 2356>2360.
>If at this Beat Gold will increase strongly thru this Zone, it's miles probable that Gold will growth strongly once more with the aid of using 238x.
Today you may confer with Canh Buy GOLD round 2348>2352
SL 2346
TP 2360>237x.
Surely Gold can have mild declines. But for now, nowadays I will observe the primary Trend`s Plan to trade. If there's any new information, I will replace greater everyone ❤️❤️

💡 XAUUSD: Analysis May 27After 3 consecutive days of decline, especially the last 2 days of strong decline, Gold D1 rebounded at the end of the week. But considering that bar D1 increased with a narrow amplitude and an upper shadow, and closed below half of the amplitude, the upward push was insignificant, and was even still blocked from selling from above. D1 Gold chart structure is reflecting a sideways trend in favor of price increases.
The main trend of H1 Gold is still down, shown by the gradually lower top and bottom structure. The current bullish cross pullback period can create a bear flag pattern - a chart pattern that continues the downward price trend. The main trend of H1 Gold today is to wait for selling from the resistances above.
💡 H1 trend: Gold moves sideways.
Today trading idea: Sell Gold.

Premium Gold idea for XAUUSD $$$$"Success is not final, failure is not fatal: It is the courage to continue that counts." - Winston Churchill
"An arrow can only be shot by pulling it backward. When life is dragging your back with difficulties, it means it's going to launch you into something great. So just focus, and keep aiming." - Unknown
"Difficult roads often lead to beautiful destinations. The best is yet to come." - Unknown
"The moment you're ready to quit is usually the moment right before a miracle happens. Don't give up." - Unknown
"The only time you fail is when you fall down and stay down." - Stephen Richards
entry 2332.04
Target 2327

XAU/USD 27-31 May 2024 Weekly AnalysisWeekly Analysis:
-> Swing: Bullish.
-> Internal: Bullish.
Price printed a bullish swing BOS followed by a bullish iBOS and continues to break all time highs.
Most likely scenario would be for price to pull back following swing and internal BOS (Break Of Structure)
First structural indication, but not confirmation that pullback has initiated would be for price to print a bearish CHoCH which is denoted by a blue vertical dotted line. Last week the CHoCH was at the same level as the internal low.
Price continued bullish before pulling back which has moved the CHoCH closer to most recent price action.
This allows price to not pull back so deeply to print the very first indication, but not confirmation, of pullback initiation.
Expectation is for price to pullback following swing and internal pullback and print a CHoCH.
As mentioned 19 May 2024 that it is also reasonable to expect price to continue bullish, bringing ChOCH closer to the current price action to initiate pullback. price has done exactly that.
Weekly Chart:
Daily Analysis:
-> Swing: Bullish.
-> Internal: Bullish.
Price has printed a bullish swing BOS. Swing low confirmed and adjusted with swing high yet to be established.
As previously mentioned, most likely scenario will be for price to pull back following swing BOS. First indication, but not confirmation, would be a bearish CHOCH denoted with a vertical dotted line which price printed.
Price has now printed a bearish CHoCH which is an indication, but not confirmation of pullback initiation.
As mentioned on 24 May 2024, price had wicked above Daily supply zone but was unable to close. This could indicate the possibility of a liquidity grab to drive price bearish to initiate pullback. This happened to be the case.
Expectation is for price to continue bearish, react at discount of 50% EQ before targeting weak internal high.
However, we do have a daily demand zone close-by so price could potentially react from that POI.
Daily Chart:
H4 Analysis:
Analysis/Bias remains the same as analysis dated 24 May 2024
-> Swing: Bullish.
-> Internal: Bullish.
Price has printed a bullish BOS.
After bullish BOS, expectation is for price to pullback.
As previously mentioned, price was showing very early signs of pullback, however, we did not have indication or confirmation.
I also previously mentioned that first indication, but not confirmation, would be for price to print a bearish CHoCH. The CHoCH line is denoted with a blue dotted line.
Price has now printed a bearish CHoCH which indicates, but not confirms pullback initiation.
Price is now in discount of 50% EQ and close to a H4 demand zone where price we expect to see a reaction. However, price has pulled back deeper mitigating the whole H4 demand zone and beyond. This could indicate that price was seeking liquidity to the extreme of the H4 demand zone.
Conversely, if price cannot sustain its bullish momentum, it may seek to mitigate the H4 demand zone below.
Intraday expectation: Scenario one: Price to continue bullish to target weak internal high
Scenario two: Price to continue bearish and react at H4 POI below to then target weak internal high which is denoted with a blue dashed line.
H4 Chart:

Long GoldI am looking for buy opportunities on Gold. This setup is based on daily setup and H4 to confirm the buy. Also volume profile confirmed buyer are resting in this price rage and my exit from this trade is based on VWAP.

XAU/USD Forecast GOLD FORECAST FROM 3 JUNE 2024 TO 7 JUNE 2024
XAU/USD changed into bearish as we see last time it dropped badly because buyers are taking their profits so we see a big drop of almost 1300 pips. Now at this point we can see a red folder week so we have to be careful for long term trade in this situation we should do scalping. Let's come to the point as you see market sweep low second time and failed to close candle below daily previous candle. Whenever market start sweeping one side it can reverse so first market go upside and out all sellers then go down in a single leg to kickout buyers. Market sweep the PDL PWL and also H1 H4 low it indicates that market want to go up. We can expect buy from 2324 to 2322 till 2338 40 and expect drop from 2339 45 if close H1 candle above 2346 then we can again see the upside move till 2370 74 so after this move our first sell from 2370 74 and second sell position will be 2378 82 we will target first monthly FVG 2373 70 this is the position if market start going upside from current price if drop from first point 2338 40 the we well sell from every retracement.
Conclusion : We will sell on every retracement until Gold tap in monthly FVG

Gold H4 chart Hello
If you ask me, as a swing trader, that where is ok for getting in a position, I say nowhere for this and at this time, but there are 2 confirmations that should be met before you get in.
I prefer to enter after that pullback of the second confirmation.
Thanks

XAUUSD TENDS TO MAKE ITS PULLBACK TO THE 70'S As the second quarter of the year draws to a close and we anticipate the formation of the next six-month candle, we foresee a rally in gold prices towards the 70s. This upward momentum is expected to take hold before a selling pressure sets in, signaling a potential shift in market dynamics. follow for more insights , comment for more bias , and boost Akcapitals ✨

Gold price continues to decrease, strategy to sell todayWorld gold prices remained stable this morning as traders focused on the Personal Consumption Expenditures Price Index (PCE) report, the FED's preferred inflation measure, expected to be released this evening. can provide a more specific view on the timing and extent of interest rate cuts by the FED this year.
According to financial and securities market analysis site MarketWatch, inflation will increase by 2.7% over the same period last year. If this forecast is correct, it means that April inflation remained unchanged compared to March, that is, this inflation level is still much higher than the FED's 2% target.
A weaker dollar, lower yields and the recent stock market sell-off have provided bullish momentum for gold, said Kitco senior analyst Jim Wyckoff.
Regarding the outlook for precious metal prices, experts say that, along with central banks continuously adding gold to their reserves, demand from Chinese investors will continue to increase in the near future. coming will bring solid support for gold.

$XAUUSD - Today’s Setup - 31/05Good morning Traders 😎
This is my setup for today 🙌🏻
Trade smarter, not harder! 💼📈
Don't miss out on potential gains - Hit that BOOST button if you like the idea 👍 Share these 👉 and make sure to Follow me for your daily dose of gold trading analysis! 💯
Remember, always conduct your own analysis before jumping in. No financial advice here.

GOLD BUY GOLD buy position for geofund news and inflation .
SL : 2338.84
ENT : 2362.50
TP 1 : 2380.16

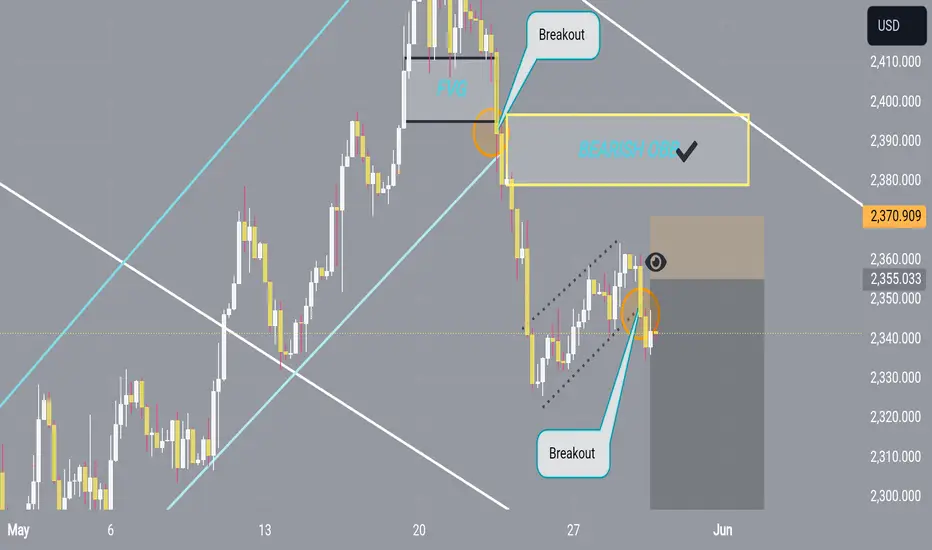
Bear flag developing in goldIntraday Update: A bear flag pattern is developing in the gold market which could influence the US Dollar (bullish) on a breakdown of the gold market.

GOLD Pair is currently on a correction as sub-wave 4 of wave 3, sub-wave 4 consist wave A,B&C, at the moment its on wave A of sub-wave 4...sub-wave A is an impulse which has wave 1,2,3,4&5 now pair is on sub-wave A as minor wave 4...one last bearish impulse is expected as minor-wave 5 of sub-wave 4

Sell on #XAUUSDPrice has broken the market structure to the downside both on the daily and the 4hr.
On the weekly chart we have a big engulfing body signaling that the sellers are coming in, so this week unless they violate my supply zone and signal buy continuation, I will be looking for sell on the levels marked on the chart.
