Trend is your friendweekly Ascending channel. bullish overall trend. impulse correction impulse structure
US30 trade ideas

US30USD IndexThis chart of US30USD index is a Bearish Harmonic Reversal Pattern and there is Divergence also and after reaching the D point .It will be Bearish pattern .

New idea about dow jonesIt’s good for scalping,it might go more up and that zone can continue to more uptrend good luck for everyone

US30 H4 and H1 Long targetsIm bullish for now on US30 and I suggest you hold longs for the areas shown on the charts.
and if you day trade look for longs.

Us30 buy setupWall street performed what we call AMD. We have price create weekly range (Accumulation). We had price spike below zone with failure to close and reversing to break Structure with momentum candle. An order block was formed along with some imbalance upon close of 3rd candle.
We might anticipate this buy setup because of the CPI data release. Remember that NFP WAS NEGATIVE FOR THE DOLLAR IN APRIL. Upon analysis of market structure of Us30. The above high is actually a swing target from the last demand mitigation more than it being a good trading zone. IT IS WHAT WE CALL EXTERNAL LIQUIDITY.
Our 1st target is the high of range. 2nd is the fvg on 4hr before suply zone. And the last one is the last swing high of the price. Goodluck

US30 2DAY SWINGThe Market has been trending and Dax has been a relative strength leader
Daily: Formation of 1-2 RTM set Up
Lows Rejected and expecting Continuation in the afternoon as its currently Lagging Indices
Buys at the current Support

DOW JONES: Two levels to buy.Dow Jones is bullish on its 1D technical outlook (RSI = 62.964, MACD = 188.520, ADX = 55.476) and has completed three green 1W candles in a row. Having reached the 0.786 Fibonacci level, the last confirmation left to see in order to call for a continuation of this uptrend is for the 1W RSI to cross over its MA. The moment it does, we will buy again and target the Channel's top (TP = 42,000). Until that moment, we will wait for a more comfortable buy lower at 38,550 (TP = 42,000 again).
See how our prior idea has worked out:
## If you like our free content follow our profile to get more daily ideas. ##
## Comments and likes are greatly appreciated. ##

US30 Intra-Week Analysis, May 14th 2024We got the break above 39000 on us30. We've now begun consolidating at key level 39500, slightly under the current All-Time-High. We will likely see buyers try to squeeze as much profit as possible so expect a bullish move to test the ATH, specifically if we see a break above 39600, clearing the range to 40000. Otherwise, if price breaks below 39400 we could see a slight correction back 39000 before continued buys.

US30 Midnight LongLooks like US30 is bouncing off the midnight open line and will continue in its bullish pattern. Good opportunity for going long


US30 (Volatility is expected to ensue.)US30 New Forecast
Today's significant news has triggered substantial volatility in the market, making it conceivable for prices to surge as high as 39670. Should prices stabilize above this level, we can anticipate an ascent to 39850.
Conversely, should prices consolidate below 39410, a decline is expected, with potential targets at 39070 and 38280. This movement is directly influenced by the immediate impact of current news events on the market.
Pivot line: 39470
Resistance Prices: 39660, 39850, 39970
Support Prices: 39290, 39075, 38820
The movement range will be between support 39070 and Resistance 39855

US30 - TUE 14 MAY 24 TRADE SETUPAMD SETUP
Price Manipulation to the upside
The market is likely to deliver to the downside
Target 2R for distribution
15:30 - Core PPI m/m
- PPI m/m
17:00 - Fed Chair Powell Speaks

Dow Jones Index (US30): Bullish Price Action Ahead of The News
In 1 hour, we are expecting US PPI report.
Ahead of the release of that data, I see a bullish price action on US30.
After a test of an intraday support, the Index started quite a long correction
within a narrow horizontal range.
Its resistance was broken with a strong bullish candle,
indicating the strength of the buyers.
The market may bounce.
Goal - 39600
❤️Please, support my work with like, thank you!❤️

US30We give attention to the highlighted area any price action we sell or buy.
And moves the stop loss to the entry after 50 pips and close half trade

NEW IDEA FOR DOWJONES Powell's reference to not increasing interest rates increases risk-taking
By examining the trend in the four-hour time frame, the Dow Jones index has broken the resistance range of the ceiling of the ascending channel in the range of 39,438-39,314, and now, due to the increase in the moving averages of the ALLIGATOR indicator, the possibility of price increase up to the resistance of the ceiling of the ascending channel in the range 40789, there are.

US30 to Daily Resistance *I am in no way a financial advisor and this post is not advice. This post is only opinion based off major support and resistance levels & market structure.
Us30 is currently traveling towards the high within daily resistance area. While price is resting on support we have positioned ourselves for a buy with stop loss right below structure of pattern on the other side of support and take profit is either at the top of last pull back(39,674)or daily resistance level (40,000). It’s always best to risk only 3-5% of account per trade.

DOW JONES made 1st 4H Golden Cross in 6 months!Dow Jones (DJI) gave us a solid bullish break-out signal after it broke out above its 1D MA50 last week (May 06, see chart below):
As you can see this gave way to a new Channel Up, which we view on the current analysis on the 4H time-frame. That is because on Friday it formed the first 4H Golden Cross in 6 months (since November 08 2023)!
This is on its own a very strong bullish signal but it gets even stronger if we consider the fact that the last 4H Golden Cross was formed while the index was in a similar pattern, recovering from August - October correction.
Dow then entered a very aggressive uptrend/ Channel Up that never broke even its 4H MA50 (blue trend-line) before January. As a result, we move our short-term Target even higher, on a symmetrical +3.45% Bullish Leg at 40300, which will be a new All Time High (ATH) for the index.
-------------------------------------------------------------------------------
** Please LIKE 👍, FOLLOW ✅, SHARE 🙌 and COMMENT ✍ if you enjoy this idea! Also share your ideas and charts in the comments section below! This is best way to keep it relevant, support us, keep the content here free and allow the idea to reach as many people as possible. **
-------------------------------------------------------------------------------
💸💸💸💸💸💸
👇 👇 👇 👇 👇 👇

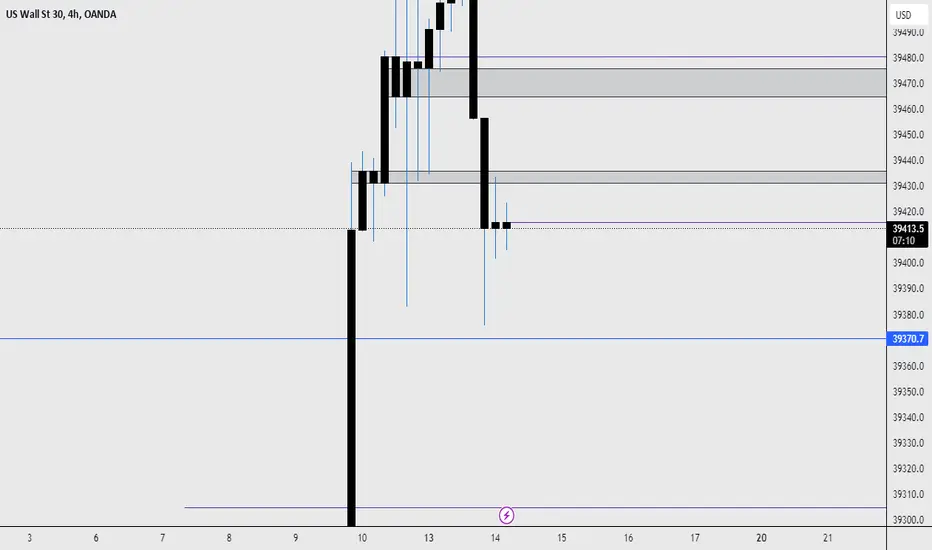
US30 short
Price broke above 38375 daily region
Price is looking to retest that region
There is a three pin pattern on the 4h timeframe
The 3 pin pattern has formed below two liquidity zones
Price retested the 39430 region in the Asia session
Momentum is too weak for now.
Waiting for a solid entry that will make be sell to 39305.
US-----30-----Bearish Technical Analysis
1.There is Crossing of 20 EMA with the Trend
2. There is Break of Trend line
3.There is Divergence in RSI
4.There is Divergence in momentum
5.MACD line crossing the signal line

DJ30 has a strong bullish momentum, could it rise further?Price is falling towards a support level which is an overlap support and could potential bounce from this level to our take profit.
Entry: 39,358.62
Why we like it:
There is an overlap support level.
Stop loss: 39,078.47
Why we like it:
There is an overlap support level.
Take profit: 40,012.33
Why we like it:
There is a pullback resistance level.
Please be advised that the information presented on TradingView is provided to Vantage (‘Vantage Global Limited’, ‘we’) by a third-party provider (‘Everest Fortune Group’). Please be reminded that you are solely responsible for the trading decisions on your account. There is a very high degree of risk involved in trading. Any information and/or content is intended entirely for research, educational and informational purposes only and does not constitute investment or consultation advice or investment strategy. The information is not tailored to the investment needs of any specific person and therefore does not involve a consideration of any of the investment objectives, financial situation or needs of any viewer that may receive it. Kindly also note that past performance is not a reliable indicator of future results. Actual results may differ materially from those anticipated in forward-looking or past performance statements. We assume no liability as to the accuracy or completeness of any of the information and/or content provided herein and the Company cannot be held responsible for any omission, mistake nor for any loss or damage including without limitation to any loss of profit which may arise from reliance on any information supplied by Everest Fortune Group.

US30 HARMONIC PATTERN AND RESISTANCE ZONEThe US30 has formed a compelling harmonic pattern, displaying a distinct W pattern that spurred the recent rally. The resistance established at the peak is pivotal, as we anticipate a reversal when the price reaches that level. This is also where we anticipate the completion of the right wing of the harmonic pattern.

NYSE Open SIGNAL: US30 LONG - 13 May 2024Like, comment and share with your peers!
Hi,
With volume from NYSE opening, we may yet see another pump from US30.
Expected entry area - 39546.25
Textbook SL 39513.56
Final TP 39699.50
Pay attention to TP 1 to 3 and risk accordingly.
Warning: trading derivative could result to loss of your capital, kindly apply caution and use only the money you can afford to lose.
You are advised to apply proper risk management while trading derivatives...!!!
BR,
Kings
Learn how to trade. See my signature below or visit my profile for more details
