NTA trade ideas

NATP longEntry - $82.40 (market price while i am writing)
Sl- any daily close bellow $80.27
Target- $90-$105

$NTAP - Kept on WL for 3 weeks just to post once I saw weakness Really just don't like this one at all. Don't like the chart, don't like the technicals, can't remember off top of my head if analyst upgraded the stock (which, is usually why I go over earnings if I'm not convinced), but the numbers were insulting. Hate trying to call a top that doesn't result in the most profitable time / target price, but so this is more of a rough draft reference. Hopefully the earnings analysis makes up for it
Key financial (bearish) factors :
- Net Income down -201% from 2016 ($76M vs. $229M)
- Net Income down -569% from 2017 ($76M vs. $509M)
- Comprehensive Income down 204% from 2017 ($35M vs. $511M) - this would explain the -34.49% decrease in equity from 2017
- $40M retained earnings in 2017 - now an accumulated deficit of ($118M)
- Debt-Equity ratio of .75
- ROA less than 1% (while goodwill & intangibles account for 25% of total assets)
- PE ratio of............... 228?


NTAP- H&S formation short from $61.07 to $50.23 & $55 Jun PutsNTRP seems breaking down forming a H&S formation. It has fair amount of insider selling & strong Twiggs money flow divergence. We think it will decline down to $50 area.
To play this we would consider $55 June puts, Which are $1.73
* Trade Criteria *
Date First Found- March 28, 2018
Pattern/Why- H&S formation short
Entry Criteria- Current price ($61.07)
Exit Criteria- 1st Target $52.23 & 2nd Target- $50.23
Stop Loss Criteria- $64.13
Indicator Notes- Twiggs money flow divergence
Special Note- Some insider selling. We would consider $55 June puts are $1.73
Please check back for Trade updates. (Note: Trade update is little delayed here.)


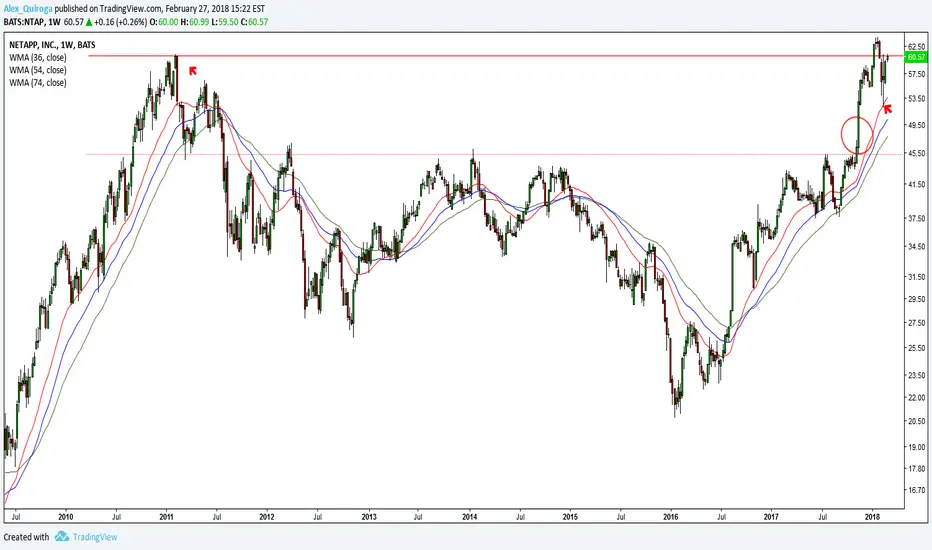
Technology stocks for 2018 #15 (NTAP)Look back in the time, February 2011 highs (red arrow)
And now in February 2018 the price is dealing again with a resistance zone in 60.00
But when the price is close to a resistance level: THE RULE SAY DO NOT BUY AT RESISTANCE
Then why I promote this buy long idea, if it will not work
There are something that the reader should know about my method:
There are rule based trading and (Discretionary) trading
I am not a trader, I am an end of day Analyst and stock picker and I pick stocks in a (Discretionary) way
this means that I have qualitative opinions and not quantitative rules
and when I pick stocks I do not use a screener like this
finviz.com
Continuing to the idea.
The haughty way the price reached the 60.00 level, tells me that the price reached that level to try to go higher
(red circle) looking a daily chart there are a overnight gap in the weekly looks like a big green candle
(red arrow) Long lower shadows, testing the support of the past gap
Gap + Long lower shadows= Bullish and resistance breakout
NTAP -Inverse fallen angel formation short from $55.85 to $51.63NTAP seems rolling over, forming an inverse fallen angel formation. We think it has good downside potential.
* Trade Criteria *
Date First Found- December 26, 2017
Pattern/Why- inverse fallen angel formation
Entry Target Criteria-Current price ($55.85)
Exit Target Criteria- 1st Target $51.63 2nd Target $47.57
Stop Loss Criteria- $59.37
Indicator Notes- Twiggs money flow divergence
Special Note- Good insider selling
Please check back for Trade updates. (Note: Trade update is little delayed here.)


Watch NTAP for Potential Upside MoveNo trade yet. Watching for a strong pop above recent small range on expanding volume.
If that occurs, enter long, with stop loss below recent low (yet to be determined as entry has not occurred yet. Target up in $45.50 region, or utilize ATR Stops trailing stop loss.

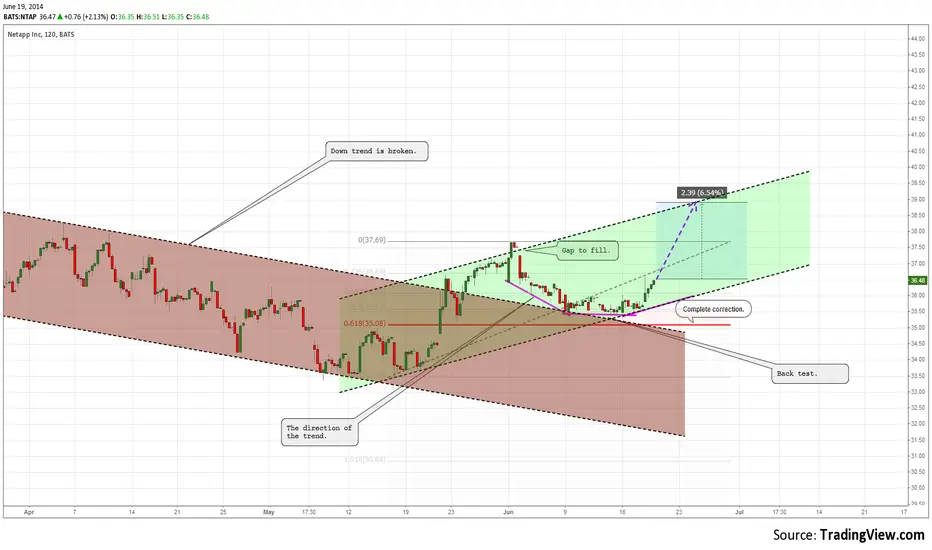
NTAP longbreak of trend cotinuation line, earnings due out 2-15 AMC, good recent earnings. trying to buy little lower around 36 with stops below recent low around 34.9. First target 39

Go $NTAP go go go Since our predictions have not reacted negatively to the jump (the should have) at all we take a positive stand for this stock! Our stand is against our "rules" to take any position close to a report - but lets have some fun!


NTAP Day Trade (Brad Reed Feb12,2015)NTAP expected to open at 37.22 for a Gap N Go. To learn this strategy for free go to www.RealLifeTrading.com


NTAP showing relative strength above important levelNetApp holds well above broken resistance level at $38. This is very important level as it is in play since March. We had some clues before break up as buyers managed to build series of higher lows with recent bottom at $36. Below this, idea will loose its luster.
As broad market entered into corrective phase, i like how this specifique stock showing us relative strength and wedging above important level. Sector of Data Storage devices also keeps its buying momentum ($WDC, $STX, $VMW).
Use your trade and risk management rules to keep odds on your side and control risk the same time. I am tier 1 here, add tier 2 if market will find its footing, add tier 3 on break og wedge. If it will go through $39, it will open doors to $41.


Netapp - Trend change possible if goes above 37.90Volume wise, more volume on Sell signals than on buying sides, but it has gone up a bit recently. The options/puts ratio although interesting as it was twice today, can change tomorrow just like it today for yesterday. Daily MAs up to 200 were violated and it is trading way below some time ago. It violated the years up trend from at 40.60 (zoom chart out). Also It has a gap that was not filled.
But it did a trend changer today. Pattern wise, it may be seen as a double bottom (but take in account that with the markets recent pullback many stocks have that, and it had a lower low on the second bottom), and once it goes above 38, i would consider it as a momentum change. It did try to change direction 4 times now but failed, although the recent green bars went outside the downside line and the price went above the middle of the Bolinder (20DMA). It also reached a previous major resistance level from 2012-09, 2013-02. so these are a couple of good sides for a buy. RSI and STOCH say its being already on top there for a sell. MACD and Acc/Distr say it is a good entry point.
Note: i am not filled on any fundamentals of the company and if Any bad news on it came out. Im not saying it wont rally now, but i do take in some more data in account. The stock also followed the markets during march, but not fully as it has been selling from way february - meaning it was not a market herd, it was going down from way back then for some reason.
Observation:
The middle resistance support line around 40.80 is somewhat symmetrical again as it was before. The top and bottom were once on the same distance before. Latest top and bottom are also on the same distance from it. Potential upside to it.
Notes:
Sell signal 1 - Top of RSI, Stoch, DMI, A/D, MACD
Sell signal 2 - did not prove to go through the resistance set up 2013-09.

NTARThe graph is at the intersection of the lower boundaries of three trends. So, the movement will be to the upper border of one of them. The size of the gap indicates the minimum movement. EMA 200 presses up-this, too, can help us.
Also, as a close stop.
