fet/btc looks goodThe Fet/BTC Chart is about to light a green candle in memory, and the macd looks like it's going to move upwards. If the green breaks the falling trend, the expected big move may come.
FETBTC trade ideas

Golden Cross & Kumo Twist FET/BTC #FET $FET #FetchAIHere we see our FET daily chart with that beautiful pump from yesterday . The neckline ( in red ) of our Adam & Eve Bottom has been hit and once we can consolidate for further upside we should hit that 1900 area which was the target of the Adam & Eve bottom. But also notice there are some other bullish indicators right now on this chart . We have a small Golden Cross happening with our light blue 50 MA line crossing up through our dark blue 200 MA line - and that should happen later today.And we had a Kumo twist on our Ichimoku cloud which has now gone from red to green. Everything is looking great with this chart ! I'll do an updated Gann Fan chart for FET very soon . Because FET has really been respecting it !
My Adam & Eve bottoms idea is linked below . Thank you !

LONG Fetch.ai ready to fly | Good chart, project, and partnersFetch.ai has been up to a lot lately. Lots of news from the team along with partnerships including names such as Bosch and Festo. With the recent Bosch test trials the price has seen some solid movement and the chart is textbook. You can see a breakout on daily time frame of a clear bull flag leading into a rise after a perfect retest. Ill keep this updated but for now I am holding.

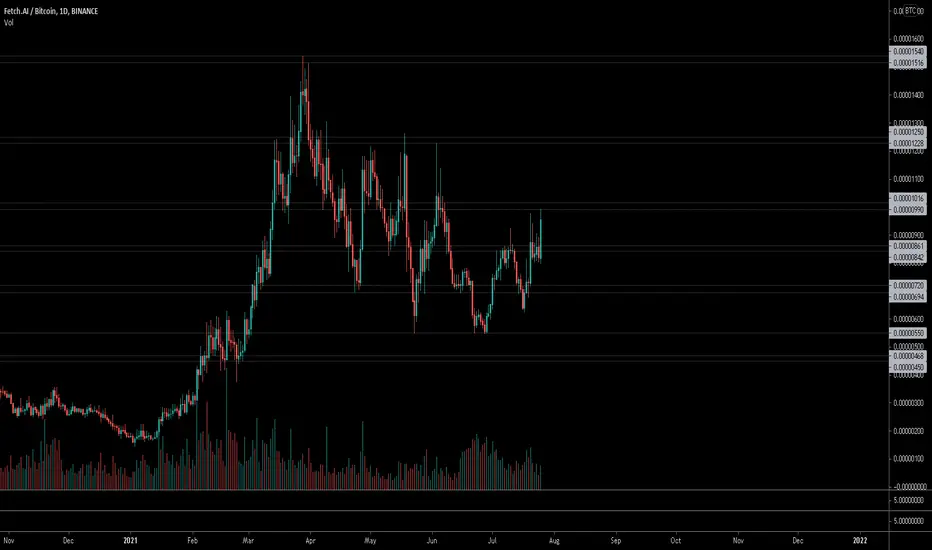
FET BTC 1-D$fet / $btc
bought this EMA 100 retest zone at 850 sats
more bids to come if it comes down to 785 sats as well

FETBTCI recommend to wait until the fet get out of the box, then we can place the trade on it.
IF he come back at 200-300sats i will catch the knife and trade on it with 20% SL.
IF he doesnt come back there, no problem i will take it when he will going out of the box by the upside.
I recommend you to set an alert on your chart it can be a huge movement.

FETBTC When in doubt ZOOM OUT! 1000% possible in FEB 2022?
FETBTC When in doubt ZOOM OUT! 1000% possible in FEB 2022?

Harvesting year-round. No shame in eating when cold.1 updates:
2 Fetch A.I.: a shoe horn for a decentralized digital economy.
3 Agent Acronym: Sheikh, Simpson, Hain , do your best work.
4 Depiction of Diogenes:
- "wave into the forrest"
- "Chopin through resistance"
5 *disclaimer; "this can be a detailed explanation of a trading method, an instruction on how to use a tool, a risk management lesson or tips on how to master trading psychology."
6
7. *glitch in the system*


$FET, Signals on this chart/timeframe are usually quite strong..$FET
Signals on this chart/timeframe are usually quite strong..
11% since latest 2D Buy already and facing 1st important level at ~1k sats
Looking for a breakout/flip above this area as continuation
#FET

fet/btc inverse head and shoulders completing Possible bullish reversal forming for fetch.ai
There is a clear inverse head and shoulders forming right now.
The right shoulder is forming right now, and it's trying to break out of a falling channel.
If it breaks out of the channel with decision it's likely to complete the right shoulder in the near term and start an uptrend against btc.
On top of that the usdt pair is showing similar pattern.
It's hitting on the resistance, the more it tries, the more likely it's going to break it.
Fetch just got listed on coinbase pro, could be the catalyst for an incoming bull run.
This post is for pure education as usual.


FETCH.AI (FET) Moving Back Above MA200 Next Target Mapped (110%)We are looking at FETBTC (FETCH.AI) and we can see its price moving back above MA200, the black line on the chart.
This level, MA200, was first tested as support 23-May and it held.
Now we have a second test and the support continues to hold strong.
Now with this support level confirmed, we can easily see prices grow.
The next target is expected at 110% or the last peak price from March 2021.
There can be additional growth of course, but this is our first barrier.
Conditions for change
If prices move and close below 0.00000550, this chart analysis is invalidated.
Remember to build a plan before you start trading.
Planing is really important to maximize potential profits and increase your success.
Planing will also help you stop any loss if a trade goes wrong.
Feel free to hit LIKE to show your support.
Namaste.

Great opportunity to buy make 800%🔥🔥🔥Hey guys!
This is project that I following and have long-term bag.
Technically in a weekly it looks great:
Price break the kumo
Chikou pointing up
Green kumo
Stay sick, Stay awesome guys...

FET - BTC$FET looking strong on the daily chart. Even in current dump of #BTC it hold up well. Still bouncing of the falling trendline, but also bouncing on that strong support level (yellow dashed line). As always it can co both ways, but it has high chance of going up instead of down. Currently bounced of trend again, so possible little retrace to 740/750, before moving up towards June fib 618 which is round 780. Break through there is good.

A Great BattleA great battle has taken place over the fate of FET/BTC. The passing of the weekly EMA ribbon, for what would be the first time ever has been mightily challenged. However, were are approaching significant support and other factors portend to a dramatic price action to follow in the weeks to come.


FETBTC Supply and Demand Zone Reality Check:
Investing/Trading is a Zero-Sum Game and based on the greater fools theory if you are not buying dividends. You buy because you seek a profit,** just like the person who sold the stock to you** - the equity stock market and the real world are not correlated to each other but a believed correlation there of.
Once understood, there is more value in knowing how your competitors/other market participants think and act. It's only logical to then track the big players and or the crowd when they are accumulating and distributing.
Risk Management, the reason you stayed **in the Game** is a Minus Sum Game, more than 60% at minimum lose money investing/trading. Having a 10% Loss takes a 12.5% Profit to go breakeven, a 90% Loss takes a 900% Profit to go breakeven.
Risk Management Principles:
1) Assume being wrong until proven correct
2) Add on to Winners, BUT treat them as individual positions
Imp. Metrics:
1) Action/Inaction Ratio for Research = The shorter the Timeframe the less research you make to not miss out, the longer the timeframe the longer the timeframe
2) The more you investigate, the less you have to invest
Info about this trade:
na

Double Bottom Is In FET/BTC #FET $FET #FetchAIHere we see our FET daily chart from Bitfinex . You can see we have had a Double Bottom ! That China miner's shut-off seemed to cause a slump in the whole market.And it definitely caused what appeared to be our Bullish Inverse Head & Shoulders pattern to fizzle out a bit at the end and form instead the Double Bottom you see now on FET . But this is a good pattern ! So don't lose hope! It's target should be the 1800/1900 area marked with a green X on the chart above. You can see our 550 bottom from a month ago ? And now last night we wicked very close to it (doesn't have to be exact but within 3% of our previous bottom and we have a Double Bottom !) And we wicked to within 18 sats of the previous bottom last night and that's about 3% from our last bottom so the Double Bottom is in !! Target of the Double Bottom will be the distance from the bottom to the neckline -once we break over the neckline - should pump the same amount up at least over the neckline ( to where that green X is on the chart . ) That would put our target on this Bitfinex chart at about 1800 but on the Binance chart the neckline is just a little bit higher and so the target would be around 1900 ! Great stuff ! I would love to see these numbers come in this Summer !
Also I'd like to say a word about being flexible and not giving up hope . This market is volatile ! And it can change quickly. Especially in a Bullrun year. But wild swings is what gives the Crypto market it's great profit potential and it's why we're here . So be prepared ! Have a Trading Plan ! And have an idea of where you would like to enter and exit . I'm here for the long haul and I have great hope for this Bullrun so I'm not going anywhere but if you are noob it may be easy to lose hope when you see the market pulling back. Just understand that wild swings are normal in a Bullrun year and we should see our FET well over 5400 sats by end of year , imo.

Inverse Head & Shoulders ? FET/BTC #FET $FET #FetchAIHere we have our FET daily chart from Bitfinex and you can see what appears to be an Inverse Head & Shoulders pattern forming .This is good .If that is indeed what it is than we are probably finishing the right shoulder formation now . And the target of that should be our 1500/1600 area again . We thought we might go back there after that Butterfly pattern seemed to play out but it didn't quite get there . These harmonic patterns don't always play perfectly. Sometimes they do but sometimes the market is quite volatile ! Anyway I feel FET will see upside and do very well this year . You can see we have also hit a red #8 of a TD Sequential 9 (the numbers under the candlesticks and one of my favorite indicators.) That should signal a turnaround is coming because as you can see - the bottom is in .

I'm a Fan of FET/BTC #FET #FetchAI $FETHere we see our FET daily chart from Binance with that colorful Gann Fan indicator on it ! This indicator really explains why FET has had the ups and downs it has had lately because it really seems to fit this Gann Fan . You can see it's a steadily rising fan we are in but we need to break up into those higher levels ! You see where that black arrow is pointing on my chart ? If FET can close above that line it will be extremely bullish because that will take us into the higher blue areas on the Gann Fan and in a Bullrun year that's where I think we are going . I know many people online have become disheartened because of all the nonsense and trolling that goes on. But stay strong ! This is probably a big Bullrun year for Crypto. You can see even in the Kucoin chart of FET that the Gann Fan should play out . Targets appear to be Fib levels but I would probably use the Binance chart for those . Anyway I'm still a fan of FET and they are set to have news this coming week too .

Bull Flag On The 4 Hourly?Whether it is or not it looks likely we will see some bullish price action shortly.
