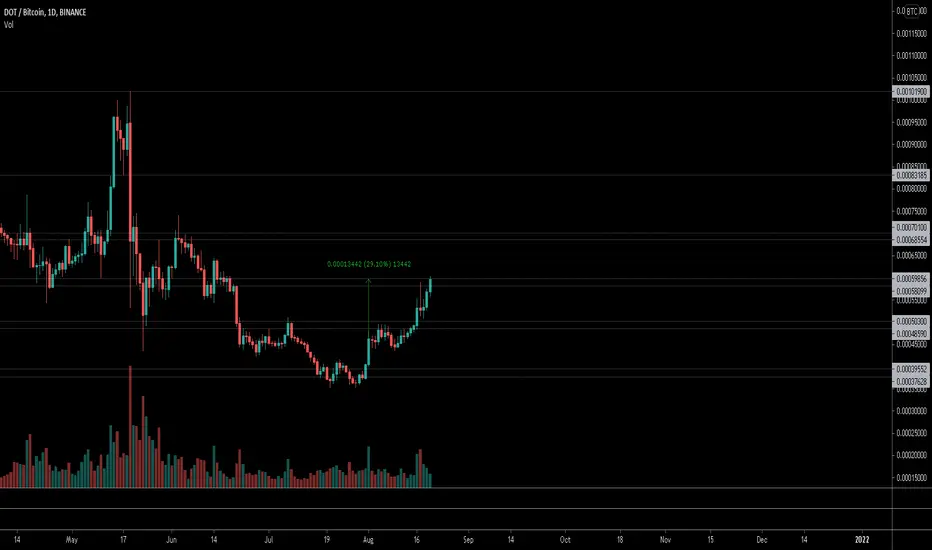
$DOT, Slowly moving up, trying ~60k sats level$DOT
Slowly moving up, trying ~60k sats level on a ~30% movement since UCTS 1D Buy signal
For now looking for volume/flip around this area as signal of continuation..
Overall looks good and market sentiment seems to be allright as well
#DOT
DOTBTC trade ideas
dot its very important that dot can break the middle line of main chart . if dot success to break and hold the middle line of main chart then buy at point that show on chart.

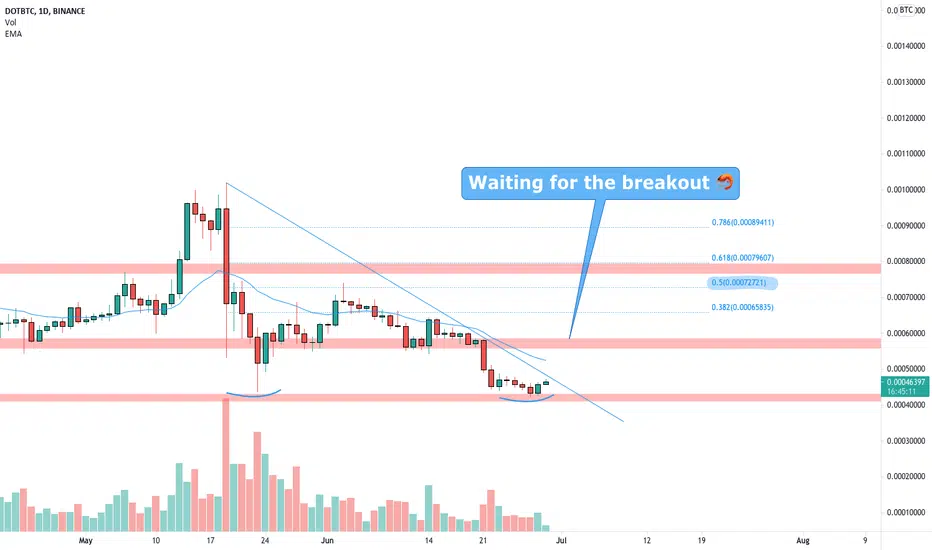
DOTBTC weekly parallel channel#DOTBTC
DOT pair of BTC is in weekly parallel channel.
a long term line rejected the uptrend price.
Although I think price will continue its uptrend and break resistances to reach 0.0009 sats (upper line of parallel channel) that is more than 75% increase from here.
and if #DOT price break out from this parallel channel and close a weekly candle above the upper line, price will go up to touch 0.0014 sats (double the hight measure of parallel channel) which is 160% increase from here.

DOT/BTC thru critical resistanceDOT has reclaimed a prime zone on the BTC pair. The critical level to stay above is 0.00057 BTC. Only obstacle left before it moons is the $29 USD resistance level.


DOT looking good for another leg upwe may see a little resistance here till 50k satosi then we are ready to go for net moon ride

DOTBTC NEW PUMPDOTBTC NEW PUMP
Dot moving in potential rising channel. DOTBTC is testing the weekly support after a retest of the Fibonacci level.


DOTBTCI think we might be seeing an inverted head and soulders pattern in daily chart from DOT/BTC. Upside potencial goes to aproximately 0.00075 by this pattern. Shall we wait for the confirmation. In the way to the high point of the pattern it might be a resistance from a suport point of the last bear, breaking could throw the prices above the pattern prediction.


DOT/BTC textbook head & shouldersHi followers,
DOTBTC created a beautiful head and shoulders reversal pattern, right on the support area, confirmed already with a breakout of the neckline.
Don't forget to manage your risk! 👌
Good luck and trade with care 🙏
If you like my content - 👍 Like, 💬 comment, 👆 follow and 👉 share!
❗❗❗
Disclaimer: This information is not a recommendation to BUY or SELL. It is to be used for educational purposes only!


DOTBTC in a Bull Flag formation Target 50k SatsDOTBTC in a Bull Flag formation - target is 50k satoshis.
Inverse H&S target just hit on my BTC idea:


DOT polkadot on weekly after the bear my marking priceLet See the polkadot move..
the marking price for now
Rank #9
Coin
On 625,358 watchlists
Polkadot Price (DOT)
$14.50
4.51%
0.0003642 BTC0.41%
0.006278 ETH2.15%

Polkadot, what next?Chart Overview
* 3 Day Dot/Btc Daily
* Gann Box
* Fibbonaci Circles (0.618 to 0.786)
* Red Shaded Rectangle (Potential Resistance formed by VPVR)
* Green Shaded Rectangle (Potential Support formed by VPVR)
* Diagonal Cross/45 degree line (Blue)
* Vertical Cross (Green)
Analysis
DOT is sitting within the Fibbonaci Circle and the two price/time Gann lines, the line below the price that forms the diagonal cross represents the 45 degree line which is considered an ideal balance of price and time and could form a strong support heading upwards. The line above could act as resistance keeping the price within a megaphone pattern. The green cross can act as pivotal price points which can push the price up or down.
Conclusion
Dot has seen a massive correction, more so than many other coins, even if it were to break down below the diagonal cross or 45 degree line, strong support is awaiting making the bearish argument hard to make. The bullish argument is strong, we are close to lots of support (the 45 degree line, the 0.786 circle, the green rectangle) and resistance is far ahead at 0.0006.
Targets
* Less Likely: Bearish = 0.00032
* More Likely: Bullish = 0.0006
What do you guys think, bullish or bearish?
*Disclaimer: Not professional advice.

Possible Breakout for DOTBuy the breakout retest of the strong resistant.
Bullish Divergence on 1Hr timeframe.
In case of Breakout from the line we would see breakout of USDT price as well which gives us more strength.

DOTBTC is testing the weekly support 🦐DOTBTC is testing the weekly support after a retest of the Fibonacci level. IF the price will lose the current support, we can see another bearish impulse until the next weekly support. If the price will have a breakout upward, we can see a recovery until the next weekly resistance.
In that case, the best choice is to wait for the clear move
–––––
Follow the Shrimp 🦐
Keep in mind.
🟣 Purple structure -> Monthly structure.
🔴 Red structure -> Weekly structure.
🔵 Blue structure -> Daily structure.
🟡 Yellow structure -> 4h structure.
⚫️ Black structure -> <4h structure.
Here is the Plancton0618 technical analysis, please comment below if you have any question.
The ENTRY in the market will be taken only if the condition of the Plancton0618 strategy will trigger.

DOT could 1x BTC if BTC goes upDOTBTC with a lot of potencial, keep your eyes on it if BTC breaks 34k.

DOTBTC is testing the weekly support 🦐DOTBTC is testing the weekly support after the price bounced on 0.5 Fibonacci level.
IF the price will hold that level and have a breakout from weekly resistance, According to Plancton's strategy (check our Academy), we can set a nice order
–––––
Follow the Shrimp 🦐
Keep in mind.
🟣 Purple structure -> Monthly structure.
🔴 Red structure -> Weekly structure.
🔵 Blue structure -> Daily structure.
🟡 Yellow structure -> 4h structure.
⚫️ Black structure -> <4h structure.
Here is the Plancton0618 technical analysis, please comment below if you have any question.
The ENTRY in the market will be taken only if the condition of the Plancton0618 strategy will trigger.
PolkaDot AnalysisBoth DOTBTC and DOTUSD are showing signs of a descending broadening wedge
This wedge tends to break up to the upside
This bullish assumption is further emphasized by the possible rounded top on the USD pair, which loves to break upwards once completed
I have thought about longing PolkaDot, but it always goes straight to Ethereum :*(
Not a bad pick though!

How low could DOTBTC go??Lost the S1 as support and currently floating in the golden pocket taken from ATL to ATH
Next major confluence is the S2 as support with the .786 also matching with a general volume support line (white)

DOT BTC uptrend Take profitsTrying to increase Sats using dot
TP on the targets and rebuy the .618 pullback
Rinse and repeat
