DJT trade ideas

Dow Jones Transports Make All-Time HighToday 09/16/20 the DJT made a new all-time high. There are two Elliott Wave counts. The Prime count has Minor wave "3" at or near a peak.
The alternate wave count has Intermediate wave (5) at or near completion. If this wave count is correct it implies the DJT could be on the verge of a multi-year bear market.
Momentum indicators favor the Prime count which implies the DJT could make additional new highs in the coming weeks.
Weekly RSI is still not overbought and is at it's highest level since the rally began in late March. RSI almost always has at least one bearish divergence when used on stock indexes.
The lack of a bearish divergence implies higher prices.
MACD lines show no bearish divergence and only a tiny bearish divergence on the Histogram. These factors also imply higher prices.
Mark

The case for a retest of highsThis is as good as any wave count of DJT. As you can see the 5th wave is extended, and in the 5th wave, the iiird wave is the extended one. If we go by having completed wave iv of 5 just now then we should have one more rally to complete wave v of 5. The DJT is the best index to count waves imo.
I'm looking for the VIX to rally with CV stocks but this hasn't happened yet so with this wavecount there is still a possibility. This could also coincide with a possible 2nd wave of CV during fall/winter.

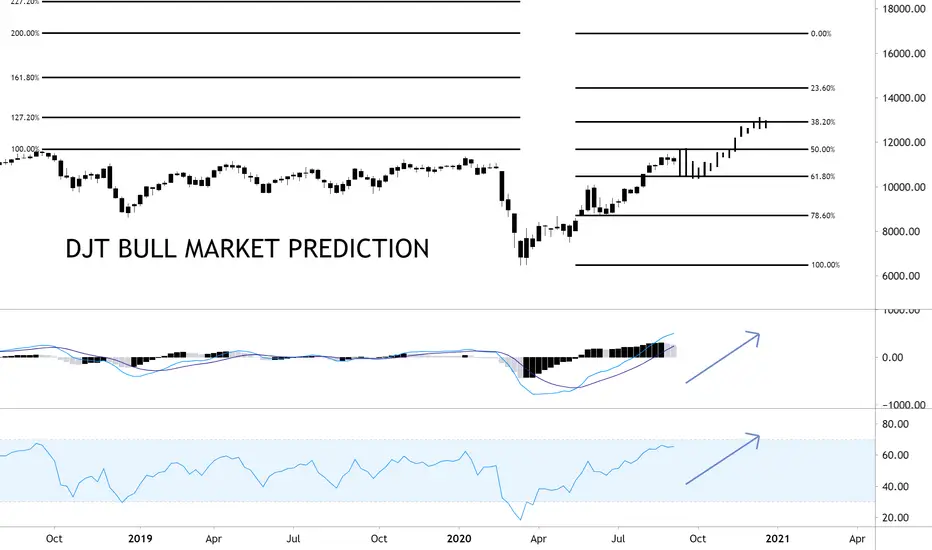
Transports Testing All Time Highs?If we know one thing in technical analysis, all time highs are not bearish. So if the Dow Jones Transports broke out to new all time highs, would that be bearish for equities? Or would that sound like the start of a new bull market? To me it sounds like the latter, so let’s have a look at the chart!
With a new weekly close, we are inches away from the all time high. The MACD is trending bullish and the RSI is not in overbought territory. These all point to the long term trend staying intact and remaining bullish. So if we assume that the market will remain bullish, what are some targets that we should have in the back of our mind? Well if we get really bullish, we could assume that the 200% extension would be a good target.
This is not the typical way to use Fibonacci retracements, but I find it very useful. I take the Fibonacci retracement tool from the top of the 200% extension all the way down to the swing low. This helps me envision key levels of retracement in the future based on my upside target. This aligns the 50% retracement, with the all time high (100% extension), and is a key level of resistance. If we fail at this point, a logical level for support is the 61.8% retracement. This would also be a higher low and would be bullish for the long term trend.
While the RSI and the MACD are both showing some exhaustion, there is just so much room for a higher low to be made that we have to remain bullish. Anything above 55 on the RSI is a higher low. If we fail at that level, anything above 40 is still a possible bullish trend. There are no bearish divergences to worry about either! So until the market tells us not to be bullish, we remain bullish. Keep your head on a swivel!
Happy Trading!
Truth TellerThe DJT provides the cleanest EW count out of all the indices. Here we see a clear 5 wave impulse. Other indices the count can get confusing, not DJT.

Salta conmigo! / Jump with me!With more lockdowns this is our best scenario.
-------------------------
Tribute to Tequila:
www.youtube.com
Good luck!

𝗧𝗿𝗮𝗻𝘀𝗽𝗼𝗿𝘁𝘀 𝗨𝗽𝗱𝗮𝘁𝗲: $DJT Weekly. Re-cross GoldenDeath cross negated and re-crossed golden. No new highs, but that may be tested before pullback
$TRAN $IYT $AAL $UAL $DAL $LUV $EXPE $FDX $SPY $DIA $DJI $YM_F #Stocks #Transports 🛫

DJT - ABC wave patternDJT has completed (X) wave in wxy double zigzag pattern after (W) major wave down in zigzag ABC in 4 Hr time frame from major top. Now it dropped in five wave impulse move in wave A, which is over today and correcting up in wave B. B wave might take 2-4 trading days to complete thereafter wave C will down. So bounce will be sell to go down. Within different sectors in US market DJT, XLF, XLP, XLE are good sell.

Expanding DiagonalCould be leading or ending expanding diagonal here, if leading next wave is wave 2 followed by wave 3 down.


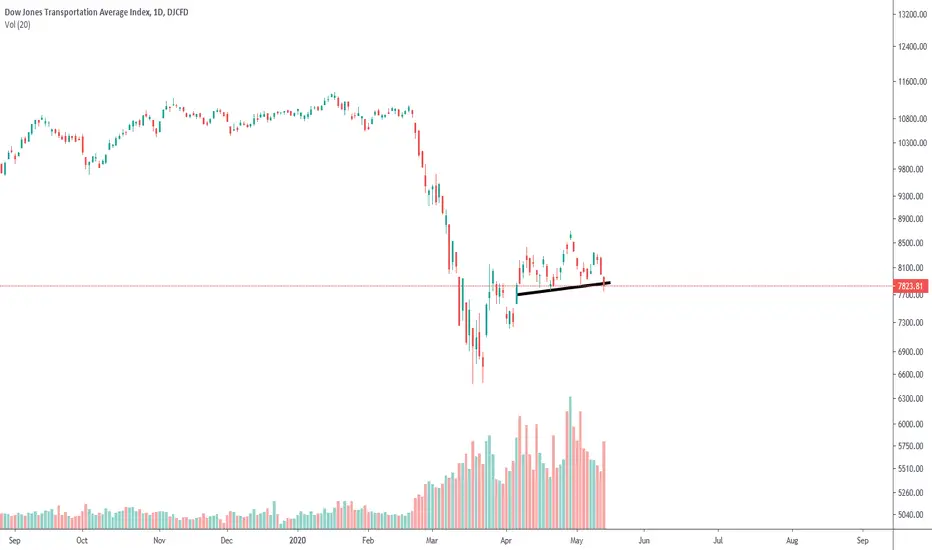
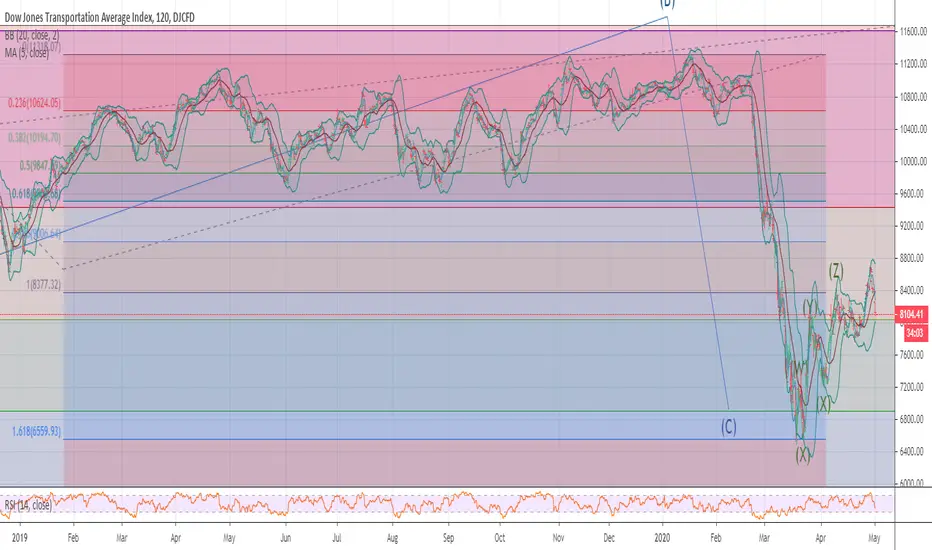
Short term/long term plansDJT is one of my canaries (in the coal-mine). I also look at DJI and SPX similarly, they give you a good idea about what's happening at the market in general. The idea is to notice the steep pink/magenta arrows (6 of them within 2 months! should be enough to learn from it) and conclude, that the blue arrows are the 'real' ones that would represent a trend instead of short lived run ups that will never last and continue permanently. I hope it's not confusing: just compare the angles of the arrows (how steep the blue vs.pink). One of them works, the other doesn't. More over, looking at the longer run (1 year ahead) this recent blue arrow could be a correction of a bear market even (like a big bear flag) after all, we are in the middle of a great recession, an "unprecedented" economic situation that has no pair since 1929, right? At least that's what I heard. So accordingly, it's more likely that this phase is a correction, and we are still in a bear market. So, maybe the V shape recovery will work now, for the 7th time? If we leave out all the news and all the economic background, the bankruptcies, the high unemployment numbers and it's consequences nationwide and only analyze the chart from a mathematical perspective (like common sense betting on odds), then yes, it's possible. A 1 in a 7 chance, so less then 15% to win, more than 85% to loose. Still wanna bet on the quick upside or some kind of a pull back, down correction, leg down or even a bigger collapse/downturn should follow any time soon? Let me know in the comments, more likely UP or DOWN?

DJT Until next year.... Transportation to take a possible hit until the first quarter of 2021. Fib cluster located recent resistance met.

The world needs transportation...These are sort of my levels. Aren't you worried about crude level? I mean... Do you think this will ever recover its shape again? It's just common sense and because this world is moved by money and transportation issues mainly.
How do you imagine this future?
Thanks again!

Dow Transport is the key indicator to check the industrialDow Transport had a rebounded move in recent weeks but is it gonna last? Probability tells me that it would not last. First up, I believe that price may reverse at the 127.2% and should it halt, the next level at 161.8% is the good move!

Dow Jones Transports - bullishSo many conflicting charts throwing up different scenarios going forward but this chart of the Dow Jones Transports is bullish to me with a 5th wave either started already or due soon. I can't count 5 waves down to complete the correction but maybe these days, with all the algos and all that, they have discounted that already are already betting on the uptrend to continue. Decent move off the lows....


4 US Stock Indexes : Touch 1st BottomAfter falling -40% since the beginning of 2020, SPX - DJI - DJT and RUT start to rise.
The story behind why they are rising might be because Investor see the reason why the market is crash at the first place is almost over.
I am not expecting to see those four indexes are rising continuously. At least there will one more fall before we can expect they rise.

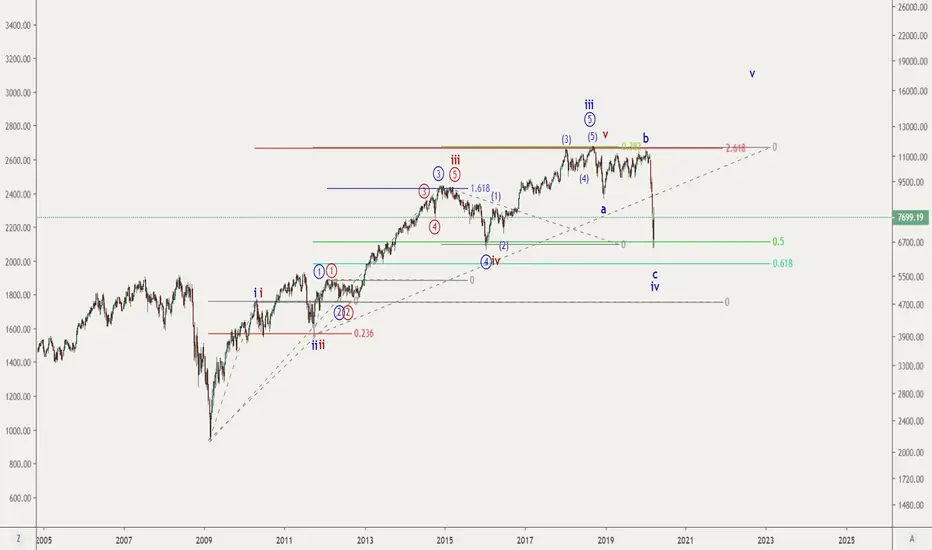
Transportations Are looking Too Good... Is A 36% Drop In Store?Dow Jones Transportation have just finished their wave 5 cycles up. Which means we are in store for a larger correction down. There we are looking at retracements to the 0.382 fib at 7800 or a 0.5 fib retracement at 6700.
If transportation were to drop, the SPX and S&P is going to drop too. Transportations has always been a early warning regardless to do that.

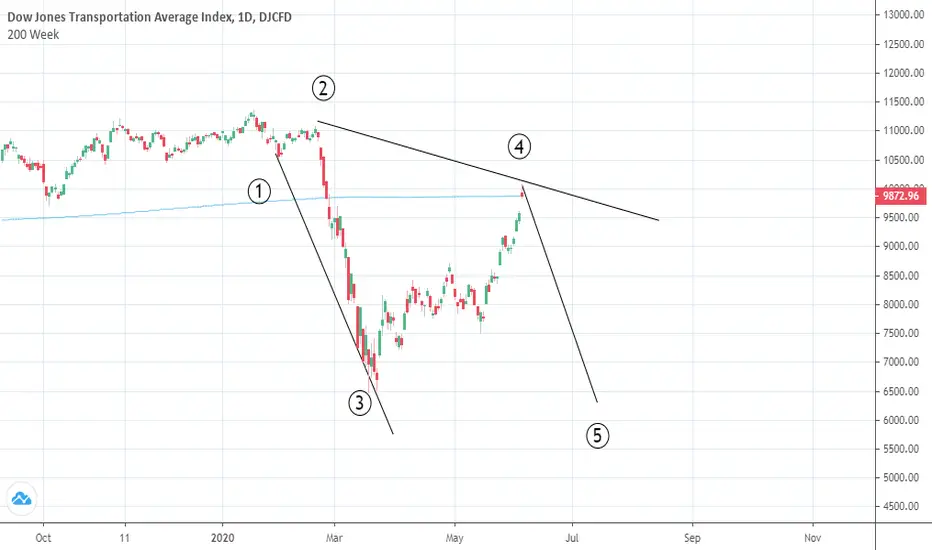
Dow Transports -2 opposing countsTake your pick folks.....one count (blue) calling for a wave 5 to follow on from a completing wave 4 correction while the other (red) suggests that party's over and we have begun a protracted correction/decline after the completion of wave 5. I know that EW theorists aren't supposed to pay attention to the news but there sure is a lot of the bad variety around a the moment. If anyone know which is more likely of these two then please let me know.....