XOMEducational purpose, not a recommendation. XOM expected to retrace back to $120 (~16.5% potential returns) in 12 to 15 weeks provided oil market is stable.
EXXO34 trade ideas

RiskMastery's Red Flag Stocks - XOM EditionWelcome to RiskMastery's Red Flag Stocks - Stocks with bearish potential.
In this edition, we'll be looking at NYSE:XOM ...
I believe this code is at a point of potential volatility.
If price can hold below $96.95 ... Bearish potential may be unlocked.
My key downside targets include:
- $88.96 (Conservative)
- $82.23 (Medium)
- $73.20 (Aggressive)
If however price breaks above $103.62 ... Bullish potential may be unlocked.
(My key risk targets - C, M,& A - are as noted on the chart)
Enjoy, and I look forward to being of further service into the future.
If you'd like to connect, feel free to reach out and comment below.
Mr RM | Risk Mastery
Disclaimer:
This post is intended for educational purposes only - Publicly available RiskMastery information & content is not intended to be financial advice in any shape or form. Please do your own research and seek advice from a licensed professional before acting on any of the information contained within this post. This post is not a solicitation or recommendation to buy, sell or hold any positions in any financial instrument. All demonstrated trades are merely incidental to the educational training RiskMastery aims to provide. You are solely responsible for your own investment and trading decisions, of which should be made only according to your own opinion, knowledge and experience. You should not rely on any of the information contained on this site or contained in any RiskMastery material on any website or platform. You assume the sole risk of any trade or investment you elect to make. RiskMastery and affiliates shall not be liable to you for any monetary losses or any other damages incurred directly or indirectly, from your use, reliance or reference of RiskMastery materials, content and educational information. Thank you for your understanding and cooperation - We look forward to working with you into the future to navigate the fine line of trading and investment success.

XOM automatic re-entryOil has taken a beating but if we back out to the XOM daily chart, it's just triggered an automatic re-entry for those brave enough to bet that the price of oil isn't going to $30/barrel anytime soon.

$XOM At Risk of Losing Support at Yellow Support ZoneXOM is at risk of losing support here. There was hope in OIL prices spiking due to the Red Sea crisis, which is affecting shipments of oil tankers. In terms of price action, XOM is at risk of losing support at this yellow support zone. I think we could get some tricky price action with a dip below and a bullish rebound.

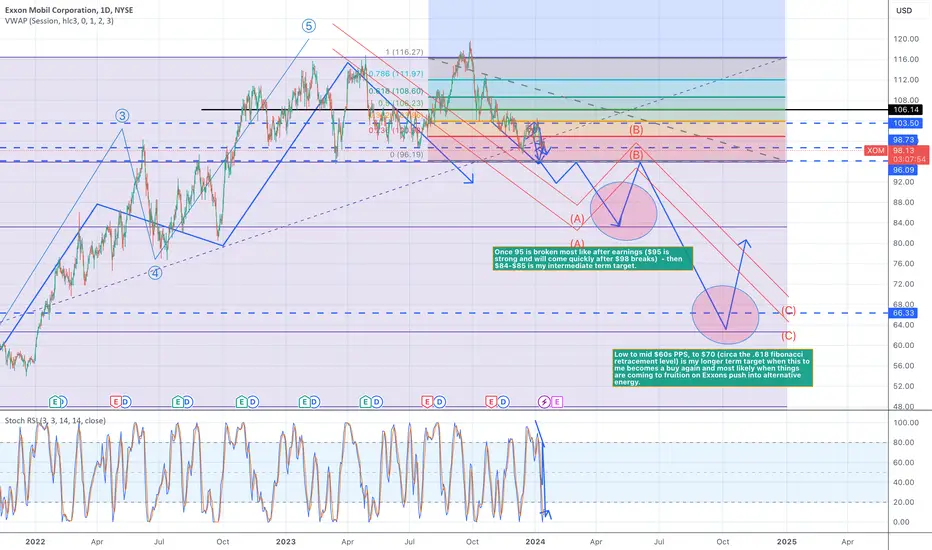
Exxon Bear, 95 next, low 80s during Q1 to Q2, eventually 60-70Low to mid $60s PPS, to $70 (circa the .618 fibonacci retracement level) is my longer term target when this to me becomes a buy again and most likely when things are coming to fruition on Exxons push into alternative energy.
EXXON MOBIL on the 1 year Support but on bearish bias.The Exxon Mobil Corporation (XOM) is again testing Support 1 (97.85), which is holding since the March 13 2023 Low but on a bearish note as it recently broke below the October 2020 Higher Lows trend-line (was the long-term Support) and remains below the 1W MA50 (blue trend-line) for the 12th week in a row.
This is obviously a long-term analysis on the 1W time-frame, but the chart can provide a clear view of the trend depending on the break-out. If the stock closes a 1W candle above the 1W MA50, we will turn bullish targeting $120.00 (just below Resistance 1). If it closes below Support 1, we will turn bearish targeting 84.50, just above Support 2 and the 1W MA200 (orange trend-line).
Note that the 1W RSI has been on a huge Bearish Divergence (Channel Down) since January 2022.
-------------------------------------------------------------------------------
** Please LIKE 👍, FOLLOW ✅, SHARE 🙌 and COMMENT ✍ if you enjoy this idea! Also share your ideas and charts in the comments section below! This is best way to keep it relevant, support us, keep the content here free and allow the idea to reach as many people as possible. **
-------------------------------------------------------------------------------
💸💸💸💸💸💸
👇 👇 👇 👇 👇 👇

XOM Excellent Long Term projectionsPrice coming down to test support at the $100 area. Believe a $140 price in the next year or two and perhaps double in five years. Adding to my position at or below 100.

Long-Term Triple-Top Formation Seen on XOM!The weekly chart of Exxon Mobil Corp (XOM) is poised to confront a neckline at $98.31 of a major long-term triple-top formation around the $120.00 mark. Should further selling unfold and a price close materialises south of the neckline, chart pattern enthusiasts will look to apply the pattern’s profit objective (a value derived from the highest peak in the pattern to the neckline that’s extended from the breakout point).

Exxon Mobil to target 111.6 after crossing resistance line1-hour chart, the stock is trying to beat the resistance, but still does not have enough bullish power.
However, it seams it will rebound soon,and after crossing the resistance (blue line) around 104.7, the target will be 111.6 - A rising wedge chart pattern.
Below support A, the next down target will be support B line.
RSI is positive

XOM - end of wave 4?Unless we see NYSE:XOM make a strong move above 105, this looks like the end of wave 4. We would expect a 5th wave to take us below the December low.

Energy Stocks: Macro Fib SchematicsThis idea beholds 6 of the largest Energy companies in the world.
(Shell, Chevron, Exxon, BP, Duke, and OXY Petroleum.)
These macro schematics have been crafted through meticulous Fibonacci techniques.
I've laid every one on a 3 month timeframe starting at 1988. History buffs will understand the time reference to the rough "start" of Middle Eastern conflicts from the West and the rise of the price of "fossil fuels".
I'm not begging anyone to understand this genius mastery of Fib tools. You either see it or you don't.
I've linked my ENERGY COMMODITIES idea below for more analysis.

XOM (Oil)Has bottomed out here at 99 support
20sma has been resistance entire sell off.. long over 102..
105 first target

BEARISH OIL WILL IMPACT EXXONAccording to Tom McClellan, Oil follows Gold with a 18-20 months and so he forecasts a low for May 2024.
Gavekal IS Research has formally uncovered this lag though without issuing a strategic forecast.
The logic is that Gold "stores" the future price of energy
It is very easy to see that a 5 Wave pattern has occurred and is currently being followed by a rectangular ABC pattern. Supports are being broken, suggesting that the 1st Wave of a 5 Wave bearing pattern is unfolding.
The target is below 65, a major support/resistance line
A Gann target would be around 60 or 1/2 of the top at 120


EXXON MOBIL: Strong buy at the bottom of a 1 year Rectangle.XOM has been trading inside a Rectangle pattern since the October 11th 2022 low and just last week the 1D RSI got oversold below 30.000. Now the 1D technical outlook is neutral (RSI = 46.595, MACD = -1.790, ADX = 43.208) but that oversold level was the first buy signal as it took place very close to the Rectangle's bottom.
The second and final validation buy signal will be when the stock closes a 1D candle over the LH trendline. Yesterday it crossed over it but closed on it. We will take this opportunity to target the 0.786 Fibonacci level (TP = 115.00) as this was the minimum target that the previous three rallies hit.
## If you like our free content follow our profile to get more daily ideas. ##
## Comments and likes are greatly appreciated. ##

Bullish IdeaThis idea is for a short options swing trade:
* All of energy did well today, not just XOM
* XLE up around 1.02% at present time
* Unusual high volume in the premarket this morning
* This got me to thinking it's being accumulated
* Nothing much happened during the day, but for the power hour there are some nice confluences
* Channel Break, though I would like to see more volume so monitoring some more
* Bullish Inverse H&S pattern
* VWAP suggests buyers are supporting stock
That's pretty much it. This has been in a heavy down trend for quite some time and is finally showing possible signs of reversal. The big question is: Is this accumulation?
Possible Reward: 1.50 — 3.00

XOM longI am bullish on oil and oil-related stocks nowadays. I estimate there will be short-term bullish move on XOM

ExxonMobil LONGExxonMobil has announced its project spending and oil output forecast for the period of 2022-2027. The company plans to spend between $22 billion and $27 billion annually, with a target of producing 3.8 million barrels of oil equivalent per day in 2024. The forecast does not include the gains from the acquisition of Pioneer Natural Resources, which is expected to close next year. The company plans to increase its share buybacks to $20 billion annually through 2025 and continue its ongoing divestment plan for its refining operations. The forecast is watched closely by investors for its spending and production targets.

XOM 3d ChartPublishing the Exxon 3d chart to track this as it heads to an important volume zone.
The entirety of the oil sector has been weak over the last few months and this is likely a guide on the overall market.
If this cannot bounce in the next -3-5% zone (highlighted), I can see this heading towards the 80-90 range in the next few months.
Previous USO idea:
Depending on how oil and oil related stocks move, this could have greater impact on the overall market, keep an eye on XLE and XOP.

Rosneft Stock Is About to Drop Big TimeThis is it. No one want Urals anymore and this is the last days, weeks or months of Rosneft management team. Good luck with golden parachutes.

XOM bottom of rangeThis asset gives a good range to trade currently we are at the bottom within 3% of it sl @ 96$ target top of range 114 with a potential breakout

XOM is likely to hold support and make a bullish reversal.Shares of oil and gas companies gain tracking a rise in oil prices.
But, there is more to support Exxon's reversal.
EXXON is to release additional details about its corporate plans, Including Its Capital Plans to 2027, on December 6th.
Its plans to become one of the world's top producers of the metal used to make electric vehicle (EV) batteries can be a trigger for long term bullish price action.
Short term technical overview also looks optimistic.
Cycle Sniper Daily indicates a potential bullish reversal from an oversold region after the stock holds 100$ - 97$ support.
Technically:
Cycle Sniper Daily indicates a bullish reversal from an oversold region after the stock holds 100$ - 97$ support.
After a daily closing above 107$, our targets are 110$, 113$, 118$, and 126$ until the end of Q1 2024.
Good Luck

XOM (Oil)Price formed a very large falling wedge at demand/support.
Breakout of wedge should happen this week
1st target is 109
2nd target 120.
Similar setup here for the energy sector XLE
