ASTBTC broke out resistance#ASTBTC broke out from long term descending resistance and pull back stayed above ascending support line, if weekly price going to close above support . rally will start soon
ASTBTC trade ideas


ASTBTC 12 HOURPatience is key
AST BTC Breaking out of long down trend on the 12 hour, possibly could see gains from this setup both short and long term

AirswapAirswap is online with Metamask. Volum grow up of day in day.
So my trade aim 1200/1300 sat = 0.6$
Take profit and buybacj 0.5/0.618 fibo

ASTBTC Cup&Handle bullish patternThe Cup&Handle pattern is characterized by a previous uptrend. I'm not really sure if it can be taken into account in this case. Therefore, with the help of other indicators, apart from the Cup&Handle pattern, I could affirm a possible new uptrend.
As you can see, the RSI is somewhere in the middle, it could continue to fall a little bit more, but thanks to the StochRSI indicator that indicates oversold, I can say that this will go up.
P.D. Not financial advice

Trading idea for ASTBTCAST may reach its previous resistance levels soon if it breaks the downtrends one by one.


AST LONGI love this coin because it has a long history of massive pumps when it breaks resistance. I think this will easily 2x - and potential 3x in the coming weeks. There's a nice hidden Bullish divergence on the OBV as well.

$ASTAST is a beast. It can go up very quickly.
Staking will be enabled on 9th of February.
Currently 200 EMA is acting as resistance. Once we pass that, beast mode will be activated. Nobody can stop it.
Bounced from previous weekly support
Bullish MACD on 1D, RSI looks good.
Broke giant falling wedge.

AST - So Much More To Give Us!🚀🚀It turns out AST is going on an absolute tear - who would have seen that coming! Oh wait -
Sorry had to fluff myself up a little there right? So looking like the gators mouth is wide open here, essentially a reverse consolidation wedge if you think about it that way - the price swings will get wilder and more volatile with time.
Luckily the aligator is pointing upwards here and it looks like there's no much down room left on this chart at this point.
I expect AST to hit $1+ USD which would put us around here for long term targets. BUT fact is AST is a great project and something of a sleeper that deserves more attention than it has historically gotten.


AST BTC LONG SIGNAL
-Wait for the candle to close above the blueline with good volume.
-you can follow the analysis on 1H or 2H timeframe, but the important is the volume.
-Go step by step.
*NB:BLUELINE: entry level
GREENLINE : take profit
REDLINE: stop loss

AirSwap (AST) Goes Above MA200, 215% Possible Next!We have one of my classic signals here when the MA200 black line is dropping while prices moving higher... ASTBTC is ready to grow.
MA200 is the last barrier that holds prices from growing on a daily timeframe when looking at altcoins.
When you see the candles above the MA200 black line, you can expect additional growth to follow.
Today, ASTBTC is moving above MA200 with increasing volume, a very strong RSI, and a bullish MACD.
Everything is pointing higher...
We have 200%+ mapped but also additional targets on the chart.
Namaste.


ASTBTC - Long - Potential 13.05%ASTBTC - Long - Potential 13.05%
Exchanges: Binance
Signal Type: Regular (Long)
Entry Zone:
0.00000502 - 0.00000512
Take-Profit Targets:
1) 0.00000532
2) 0.00000579
Stop Targets:
1) 0.00000462


3 probebly target for ASTBTCbuy time for #ASTBTC #AST
3 probebly target for ASTBTC
We have bullish action in many altcoins.

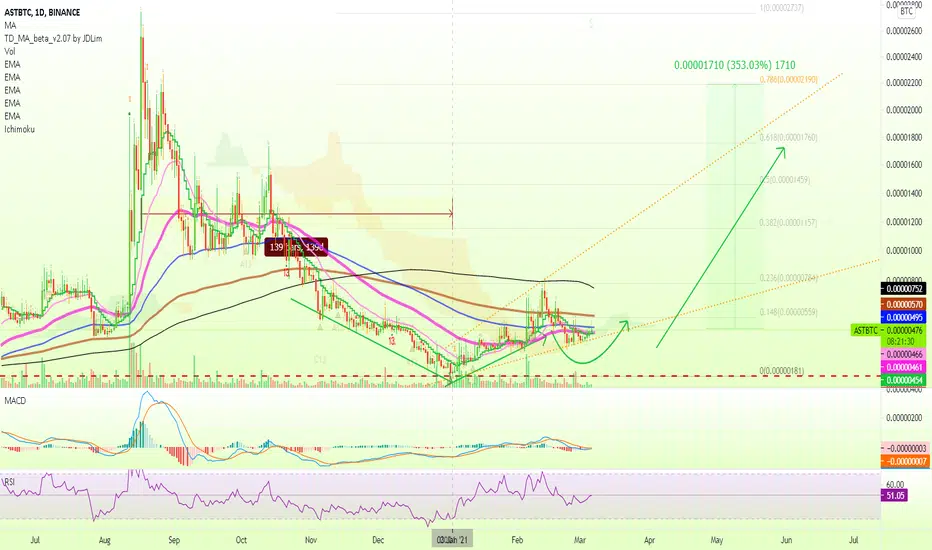
350%+ Mapped for AirSwap (AST)After the massive bull run AirSwap (ASTBTC) had back in 2020, what followed was a 4.5 months long correction that found a low on January 3, 2021...
We have been having bullish action since.
Here we have the Adam & Eve bottom pattern when we look at the chart long-term, as well as a new uptrend confirmed after the 3-Jan. low.
This is good news.
With a higher low now in and prices closing above EMA50, there can be additional growth.
Remember to build a plan/strategy before trading.
Thanks a lot for your support.
Namaste.