ARBUSDT falling wedgehi traders,
ARBUSDT on 1D time frame looks primed for a trend reversal.
We can that the price formed a falling wedge pattern.
Once we get a successful breakout, a long position can be taken.
3 targets are shown on the chart.
Good luck
ARBUSDT trade ideas

"ARB" RBI came out!!!Hello! friends, How have you been?
I brought a VERY attractive chart for you today.
It's the ARBUSDT chart that can reverse the long bearish. If you take a position, It can better attractive position as the RR.
■It is being adjusted after breaking the big downtrend line.
■ Adjustment value is 0.786 (very stable)
■it is being Retested of bullish.
■The horizontal resistance line just above the overlaps with zone as a very having heavy buttocks zone.

ARBITRUM SHORT TRADE SETUP - UPDATE
From psychological point of view - price was going high and they was successful convincing literally everyone that it will continue to go up then all of a sudden they nuke on their euphoria, then those who are a little bit brave to take the short of it are being targeted along the ones who are seeing this a bull run continuation so they take in both ways and finally cause frustration for both short term bulls and bears, then when the price drops to the last leg there is no enthusiasm and that's when the real deal starts.
If you missed entry at first now is your second chance. BINANCE:ARBUSDT
PREVIOUS ANALYSIS
OTHER ANALYSIS
BINANCE:PEOPLEUSDT
BINANCE:RSRUSDT
BINANCE:NEARUSDT
BINANCE:GMTUSDT
BINANCE:RONINUSDT

ARB - Daily Shortterm Trend & Support/Resistence Trade Signal - ARB now completed a correction and are ready to return to gain higher.
The new opportunity at the current price
🟢 Trend: Bullish 🚀
🟢 Support: $0.92
🟢 Target: $2.4
------
Current: $ 1.2

ARBITRUM UPDATE - $0.7 INCOMING
Nothing much just doing what I believe it should do
PREVIOUS ANALYSIS
OTHER ANALYSIS

ARBUSDT Elliott Waves Analysis (Local Setup)Hello friends.
Please support my work by clicking the LIKE button👍(If you liked). Also i will appreciate for ur activity.
Everything on the chart.
Entry: Market and lower
Targets: 1.3 - 1.45 - 1.6
after first target reached move ur stop to breakeven
Stop: 0.95 (depending of ur risk).
ALWAYS follow ur RM
risk is justified
Good luck everyone!
It's not financial advice.
DYOR!

#ARB "Rally Mode: Your Chance to Buy and Prosper!"**Technical Analysis Chart Description:**
Welcome to my Technical Analysis charts on TradingView! Before we dive into the analysis, it's essential to understand some important warnings:
1. **Subjectivity Alert:** Technical analysis involves interpreting market data and chart patterns, which can be subjective. Different analysts may interpret the same data differently, leading to varied conclusions.
2. **Historical Performance Doesn't Guarantee Future Results:** Past price movements do not guarantee future price movements. While historical data can provide insights, it's crucial to consider other factors that could influence price action.
3. **Risk of False Signals:** Technical indicators and chart patterns can produce false signals, leading to potential losses if relied upon blindly. Always cross-verify signals with other indicators or fundamental analysis.
4. **Market Volatility:** Crypto markets are highly volatile and can experience rapid price fluctuations. Be prepared for sudden and unexpected price movements, which may invalidate previously identified patterns.
5. **Risk Management:** Proper risk management is essential. Never invest more than you can afford to lose, and consider using stop-loss orders to mitigate potential losses.
6. **Emotional Bias:** Avoid emotional decision-making based on short-term price movements. Stick to your trading plan and strategy, and don't let fear or greed influence your decisions.
**Disclaimer for Crypto Trading:**
Trading cryptocurrencies carries inherent risks, and it's important to understand the following:
Cryptocurrency markets are highly speculative and can be subject to extreme volatility. Prices can fluctuate significantly within short periods, leading to substantial gains or losses.
Investing in cryptocurrencies involves the risk of total loss of capital. Unlike traditional assets, cryptocurrencies are not backed by any tangible assets or central authority, making them inherently risky.
Regulatory uncertainty and market manipulation are additional risks associated with cryptocurrency trading. Regulatory changes or negative news can have a significant impact on prices.
This analysis is for informational purposes only and should not be construed as financial advice. It's crucial to conduct thorough research and consult with a qualified financial advisor before making any investment decisions in the cryptocurrency markets.
By using this analysis, you acknowledge and accept the risks associated with cryptocurrency trading and agree to trade at your own discretion. The author of this analysis shall not be held responsible for any losses incurred as a result of using the information provided.

LONG #ARBUSDT target 1.6$LONG #ARBUSDT from $1.19 stop loss $0.9
1h TF. The asset moves in a parallel channel after the spill. There are horizontal resistance levels. Now we have pushed off from the support level of 0.9$-1$ and are moving in an uptrend. There is also a support level of ~ $1.14, from which you can expect a rebound when the asset price falls. Open long, the first goal is ~1.3$, the final one is ~1.6$

Arb local swing trade ideaARB followed Ethereum and pumped around 25%! Rumours now around EthereumETF can push the prices to new ath for many coins. BINANCE:ARBUSDT
Possible Targets and explanation idea
➡️Weekly timeframe, after listing still relevant fib. IAP model
➡️We come back and close W October 2023 Fvg in May 2024
➡️Based on my money power indicator you can see periods where whales inflow money
➡️Local swing trade target its a new ath around 200% everything what above -open space
Hope you enjoyed the content I created, You can support with your likes and comments this idea so more people can watch!
✅Disclaimer: Please be aware of the risks involved in trading. This idea was made for educational purposes only not for financial Investment Purposes.
---
• Look at my ideas about interesting altcoins in the related section down below ↓
• For more ideas please hit "Like" and "Follow"!

Arbitrum ($ARB) Set for a Bullish Breakout soonThe Arbitrum DAO has approved an eight-week pilot M&A program following overwhelming support for the proposal. On-chain metrics suggest that Arbitrum ( AMEX:ARB ) may experience a rally soon, despite a recent 7.5% increase in its value.
The pilot program received over 99% support from DAO members and aims to conduct data-driven research and discussions to inform the Arbitrum DAO's decision on the operationalization and funding requirements of the M&A unit. The goal is to utilize M&A as a growth driver for the Arbitrum ecosystem, expanding non-organically through acquisition opportunities to enhance capital allocation methods.
Additionally, on-chain metrics indicate potential for a rally in AMEX:ARB 's value. Despite the recent gain, a significant percentage of ARB addresses are still out-of-the-money, suggesting that investors may be holding onto their assets in anticipation of tangible price appreciation. Furthermore, with 55% of ARB's circulating supply held in out-of-the-money addresses, caution is advised for investors looking to open a position in the Ethereum Layer 2 altcoin, especially considering the large holdings by whales.
Although recent activity has shown equal participation from bulls and bears, recent price movement suggests signs of a potential rally. The market value to realize value (MVRV) ratio has also confirmed these rally signs with a 6.54% growth in the past 24 hours. It is important to note that a bearish change in the general crypto market sentiment could invalidate this thesis.

### ARBUSDT UNIQUE IDEA ****#ARBUSD
UPDATE
Hey dear members hope you all are enjoying our ideas and analysis. Now we are here to discuss about ARB
ARB had already breaked the main falling wedge pattern. We can see gain here upto 30%+ soon ✍

ARBARB is one of the currencies that I see good positivity
Buying places from 1.016 - 0.9975
My goals are there
T1: 1.2263
T2: 1.3704
T3: 1.5709
Places he must penetrate in order to complete
1 - 1.1413
2 - 1.4786

ARB looking good for longwaiting for ARB to trade near the mid point of Daily FVG from where we can take long positions if btc stays stable.
●Will confirm in LTF to open long positions.
●Target will be 1.6$ , $2

Arbitrum (ARB)Arbitrum a highly anticipated project, is an Ethereum layer-two scaling solution that uses optimistic roll-ups to achieve its goal of improving speed, scalability, and cost-efficiency. There are not enough candles to see the big picture. But the short-term view is that there is a descending channel, and if ARB breaks it upward, an impulse wave can be expected. Let's see what happens.

ARB priceThe Arbitrum currency and its use in reducing the fee can sometimes indicate a clear future for this currency, on the other hand, the price has reached its starting point and the lowest price of the chart, and we can expect an increase from this currency in the long term.

ARB/USDT.P Long IdeaLong Idea for ArbitrumDescription:Arbitrum is showing strong potential for growth as Layer 2 solutions gain traction in the Ethereum ecosystem. Recent developments and increasing adoption of Arbitrum's scaling solutions suggest a positive outlook.Key points of my analysis:Technical Analysis:Breaking Resistance Levels: Arbitrum has broken through key resistance levels, indicating a bullish trend.Bullish Patterns: Formation of bullish patterns like the "Ascending Triangle" suggest further upward movement.Momentum Indicators: RSI and MACD show positive momentum, supporting a continued rise.Fundamental Analysis:Adoption and Usage: Increasing usage of Arbitrum for DeFi projects and transactions is driving demand and price appreciation.This idea is based on current market analysis and may need adjustments as market conditions evolve. Monitor closely and manage risks accordingly.

ARBUSDT.1DUpon examining the ARB/USDT daily chart, several key technical indicators and levels emerge that help forecast potential price movements.
Trend and Resistance Analysis:
The price has experienced a significant decline from its high of around 2.4250 USD. Currently, it is trading at approximately 0.9749 USD. The price has been following a downward sloping trend line, labeled as R1, indicating persistent bearish sentiment. There are two major resistance levels to watch: R1 at around 1.3914 USD and R2 at approximately 1.3914 USD. The first resistance level (R1) has been tested multiple times but has held firm, preventing any upward breakout.
Support Levels:
There are clear support zones identified on the chart. The primary support level, labeled S1, is around 0.5000 USD. This level has been tested before and has shown considerable buying interest, suggesting it could act as a strong floor for future price declines.
RSI and MACD Indicators:
The Relative Strength Index (RSI) is currently at 36.59, indicating that the asset is nearing oversold territory. Historically, this suggests that a reversal could be imminent, as the selling pressure may soon exhaust itself. The Moving Average Convergence Divergence (MACD) indicator shows a bearish trend with the MACD line (blue) below the signal line (orange)
, though the histogram indicates a potential weakening of the bearish momentum.
Volume Analysis:
There is a noticeable volume pattern where the price dips are accompanied by significant trading volume, which typically suggests strong market reactions to the price movements.
Conclusion:
In conclusion, the ARB/USDT pair is currently in a bearish trend but is approaching key support levels that might offer a reversal opportunity. The RSI indicates a potential oversold condition, which, coupled with weakening bearish momentum in the MACD, suggests that the price may stabilize or attempt a minor rally towards the first resistance level (R1). Traders should watch for a break above the R1 trend line to confirm any bullish reversal. Conversely, a failure to hold the S1 support could lead to further declines.
Overall, the market sentiment remains cautious, and close attention to the aforementioned levels and indicators is crucial for making informed trading decisions.


CHANNEL BREAK OUT A channel breakout is a trading concept in technical analysis where a security's price breaks out above or below a established trading channel, indicating a potential new trend or direction.
A trading channel is formed by drawing two parallel lines, one representing support and the other resistance, which contain the price action over a specific period. The channel can be ascending, descending, or neutral, depending on the trend.
A channel breakout occurs when the price:
1. Breaks above the upper resistance line (bullish breakout)
2. Breaks below the lower support line (bearish breakout)
This breakout signals a potential change in the trend, as the price is now moving outside the established range. Traders and investors often consider channel breakouts as a trading opportunity, as they can indicate:
1. A new trend is emerging
2. A continuation of the existing trend
3. A reversal of the existing trend
On this Chart we will be focusing on the bullish side because it's a bullish break of candlestick but be on a market watch about the white doted line which is the support and resistance which I have identified. If you look closely you will notice a 200 Moving Average . Be careful at the point.
By recognizing channel breakouts, traders and investors can potentially capitalize on new trends and market movements.

ARBUSDT-Bullish Scenario-Falling Wedge Breakout Completed
Dear Traders,
We are convening a discussion focused on #ARBUSDT
THE Falling Wedge Pattern Breakout Has Already Done ✅
So,I Expect a Bullish Move of 50% 🚀
Regards: AnnaTradeCharts
#Bitcoin #Crypto #Ethereum #Cryptocurrency #CryptoTrading #BTCUSDT #ETHUSDT #ALTCONS #USDT CRYPTOCAP:BTC CRYPTOCAP:ETH CRYPTOCAP:USDT CRYPTOCAP:PEPE CRYPTOCAP:DOGE NASDAQ:ALT

My view on ARBITRUMBearish divergence in place on the RSI & Stoch. Will visit bottom resistance line before going up

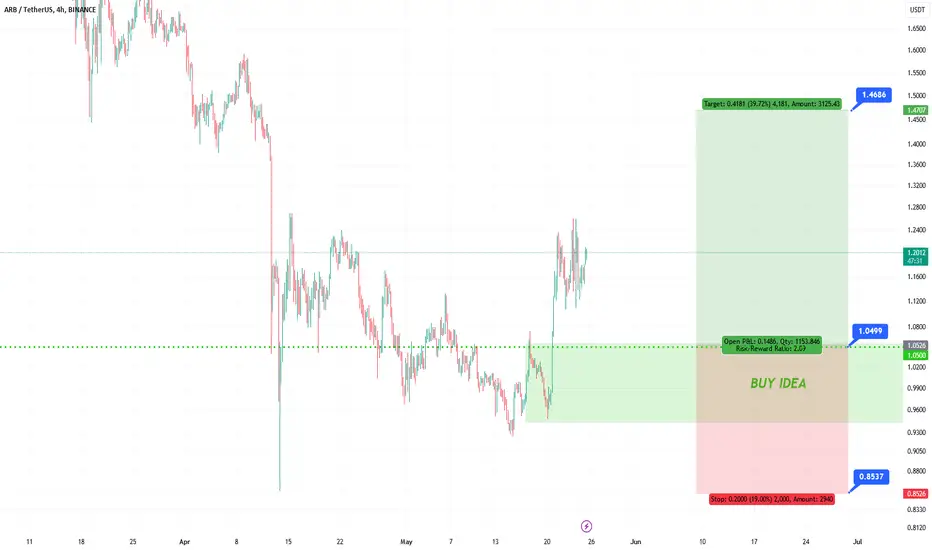
BUY IDEA ARB/USDTAccording to recent price movements, we can expect an upward movement in the specified support area
Arb Can give 10% gainDue to chart Trend we can give this gain
In crypto market btc break 63k we will bet on the long
