GDXJ wish you a Happy New BearNothing has changed. Just a rush in Gold and the hope of the beginning of a new bull market.
Bear will be awake this winter in the gold - miners sector.
Target for miners, within the trend: 32$
Gold 1550$
Timing: February March 2022.
GDXJ trade ideas

Junior Gold Miners is a buy at this point in price and time$GDXJ is poised to make a bounce here. A potential bull flag. There are two major patterns that could play out. Both gartley harmonics of the type AB=CD. One big (white) and one minor (blue). The minor one also closes the cricled gap if it reaches its destination at 51$. If one is more long term oriented then waiting for the big harmonic to play out could be worthwhile, target 82$. Stop loss under 37.

GDXJ LONG! Gold Miners bouncing off support. Entry = $43.55.Entered at GREAT price right up against Major Support. Usually I post pics with MACD. Today I am not. Showing this chart as prime example of how Price Action dictates trade. Only using a simple system of Trend Lines and Horizontal support and resistance lines and some observation of candle patterns and you have all you need to trade. Another trade BUY signal will be once we break above the recent high of Oct 25, 2021 @ $45.75.
Entry = $43.55
SL = $41.89
Target Price = $54.86
R = 6.81

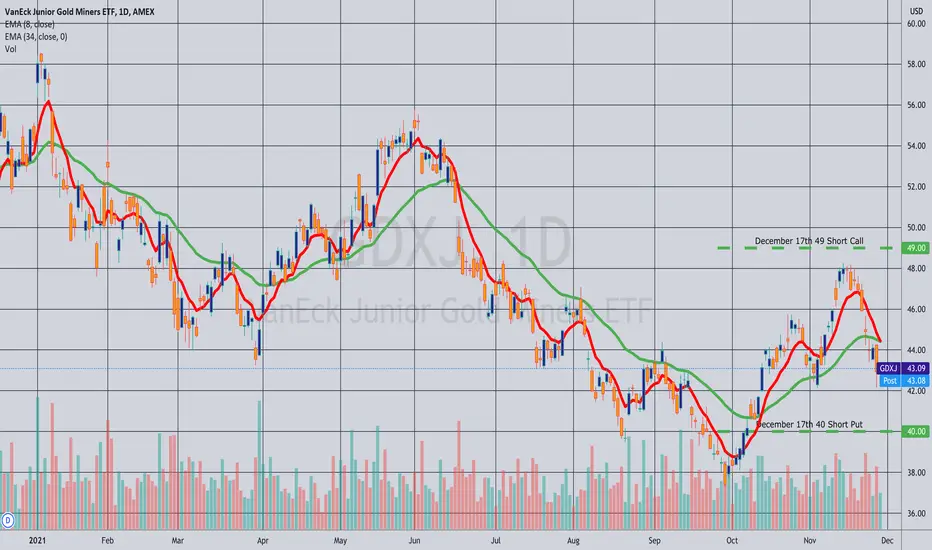
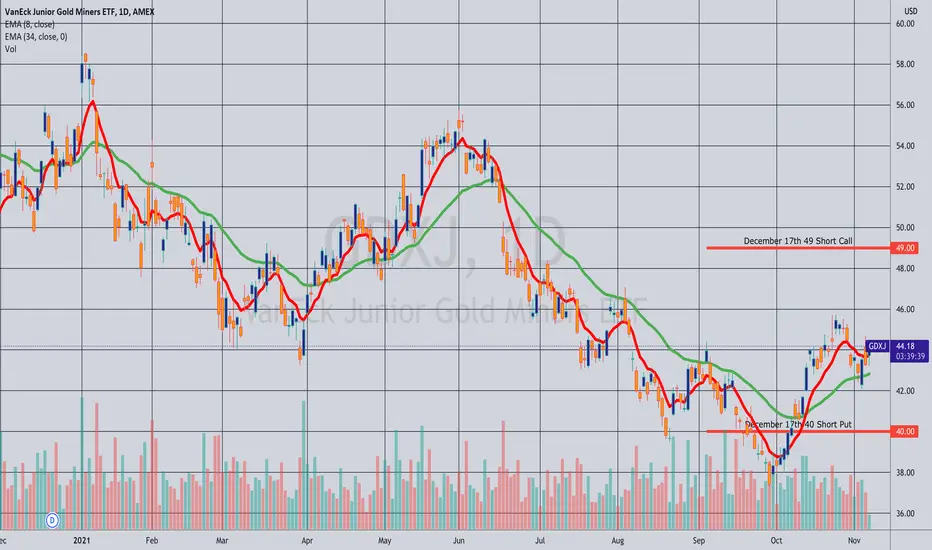
Closed: GDXJ December 17th 40/49 Short Strangle... for a .63 debit.
Comments: In for a 1.26 credit, (See Post Below), out for a .63 debit today via an order to take profit at 50% max. .63/$63 profit with 18 days to go.
GDXJ crossroadTwo possibilities.
next week down almost for sure. And the 3th of November, again Fed meeting, with noise in the market.
How the fall comes, could show the mid term future in gold and gdxj.
Something between 40$-42$ I expect as almost sure.
And what cames afterwards is to be seen.
Could see another leg up, surprising everybody as November is always a week month for gold and the main trend has been bearish since June
or not...
And the bearish trend in gold remains powerfull and miners go down and down, what i was expecting to happen, but didn´t
Short term: bearish (next week)
Long term: Bearish (Months to come)
but caution for another leg up continuation in November as possible.

Gold pulling a Crypto move out of the bag?Things again look familiar here. Feel like leaps are going to pay big.

Opening (Margin): GDXJ December 17th 40/49 Short Strangle... for a 1.26 credit.
Comments: The only exchange-traded fund with 30-day implied >35% which I currently don't have a position in. ROC of 26.3% as a function of buying power effect; 13.0% at 50% max.
GDXJ and GOLDGDXJ and GOLD is time to rest a while . as i forsee from the chart... it start slowing down and got chance to rest...
let see

GDXJ DailyAccording to technical analysis, gold and silver stocks appear to be preparing for medium-term growth.

GDXJIn this video I will provide you with an broader picture of the GDXJ chart and I am going to show you why I think that there are a lot of indications that we might see a shift in the trend to the upside.

Gold Miners: Juniors vs Seniors - Here's What I'm SeeingOne of the factors I'm looking at in determining whether global gold mining shares can reverse their multi-month bearish trend is the ratio between junior miners and seniors miners.
The weekly chart sees the price continuing to trade within a multi-month downward channel and below the downward trend line. So far this week, Juniors are outpacing Seniors by 1.41% on a relative basis and while the trend is broadly lower, there are minor signs of a potential reversal.
(1) The 14-week RSI has made an early breakout, possibly leading the price;
(2) although below the centre line, the MACD has made a bullish crossover.
A similar structure is seen during March 2016.
Juniors are more geared to the gold price thus signs of relative outperformance could be an early read into the broader sector.

PM Technical AnalysisXAU/USD – Weekly
Very disappointing that we were not able to push through the $1835 resistance. We need to be more patient, I guess. The wide range is $1670 - $1835. And currently we are right in the middle of it. Sit tight on your hands is the best advice I can give you right now.
XAU/USD - Daily
No change on the zic-zac price action. Unfortunately, there is no additional comment or view to what I have said on the weekly chart.
XAU/USD – 4 hours
The mentioned fallback into the $1800 zone has happened and we even dipped into the low $1700 area. Current price action looks promising though. It is the only timeframe where we are above the base line (blue line). Watch the other time frames for that indicator.
XAG/USD – Weekly
On a “line” chart we are still in a valid potential bull flag. But I have to say price action looks weak and the lower leg of the flat might give way over the next few weeks. Then we go back to a very large sideways consolidation.
XAG/USD – Daily
On this time frame it looks even uglier. Potentially, we just texted the break out of the lower leg of the bull flag and could continue with lower price action.
XAG/USD – 4 hours
The only positive sign here is that we are trading above the base line (blue line). But I want to see a push back above the $23 level to turn mildly bullish.
GDXJ – Weekly
Not looking good. The break out on a closing level is confirmed. We dipped back into the first liquidity pool at around $38. If the we move lower the next liquidity pool comes in at around $33.
GDXJ – Daily
And back below the base line… No sign of any reversal so far.
GDXJ – 4 hours
No additional comments. No reversal signs in sight.
XAU/USD - Spot
Time Frame Overall Trend Conviction
Weekly Sideways High
Daily Sideways medium
4 hours Up medium
XAG/USD - Spot
Time Frame Overall Trend Conviction
Weekly Sideways High
Daily Down Medium
4 hours Up Medium
GDXJ – VanEck Vectors Junior Gold Miners ETF
Time Frame Overall Trend Conviction
Weekly Down Medium
Daily Down Medium
4 hours Down Medium

drop is in sightTarget at 36-37$
in comming months, if we dont get there in the next two weeks. Gold Market is very bear

GDXJ SUPPORT LONG I see support with an old 9 day Demark Count Look Left we are at day 9 of a downward trend. We are at the bottom of a Boillinger Band on the daily. We are at the mid line of a LR on the daily with Stochastic bottomed out. Gold hit bottom of daily Range . I hope Im right. 7 percent in the next week. Thank you if you actually read this. Please comment. Oh we are at the end of a GANN cycle for a while in Consolidation

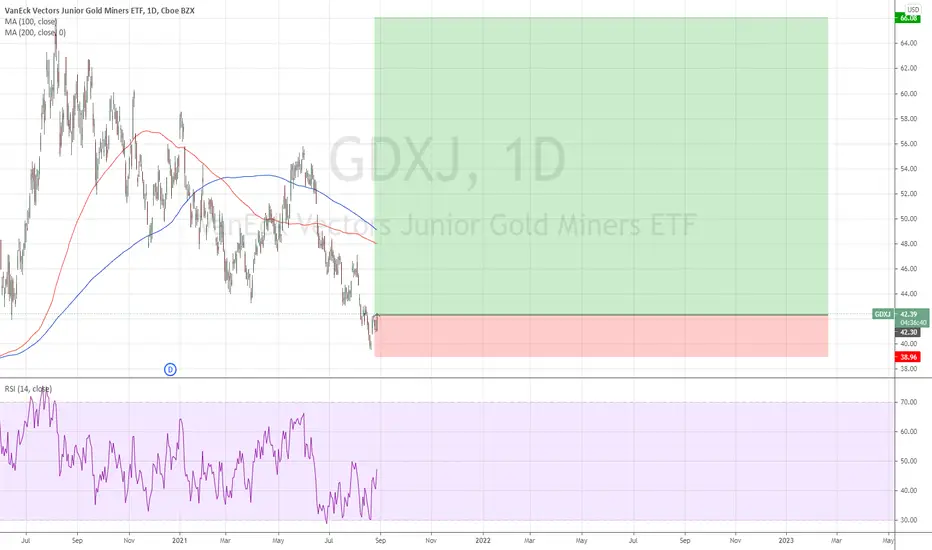
Kind NUGG: JNUG and GDXJ - 10RSetup is the same in both JNUG and GDXJ ---
Inflation fears and BTC being a crazy eyed old man --
Run to the GOLD play, as leveraged as you can get (unless you like GC, mwhahaha).
Enter Anywhere in that green box with stop just below.
10R worth the 50/50 shot

Junior Gold Miners compared to the price of gold. Fundamentally Gold should be trending higher. Or maybe a better way of saying it is fiat is trending lower compared to Gold due to its misuse. NEVER underestimate how much gold can move when real fear kicks in. This chart says there is a bit more downside left in the juniors before it bottoms out. In my opinion, nibbling now and backing up the truck when we test the ark in a few months would be the best choice.
Many see the gold bull market lasting until 2028-2030. This arc just so happens to paint a picture of the juniors miners out performing gold until just such a time. Just one more piece of evidence for the pile. also it is a great leveraged trade on gold itself!

2021-08-28 GDXJ - supportPrice is still hovering at support. Last week had a nice bounce. Looking for bullish pattern to emerge on daily chart

GDXJ - LongReasons for going long is the price is likely to go up, so by going long I am likely to make a profit because I will be able to sell it for more than what I bought it when I close the position that I longed.
Bearish GDXJTrendlines : Downtrend lines in place. Until they break, appears to be headed much lower.
Support/Resistance : $41.93-$43.24 support area broken.
Moving Averages : Below all major MA’s: EMA 9, SMA 20, 50, 100, 200.
Chart looks like death. Bearish unless shorter-term downtrend line breaks. $35 price target.
GDXJ will lead Gold lower.

GDXJ double bottom - could this be the reversal?Double bottom price action on the GDXJ
Price of the double bottom also hitting S/R zone of the previous 4 year base break-out.
Does this indicate a reversal in the last 12 month pull-back and the start of a new break-out?


Buying GDXJ at Support with $51 Price TargetI'm looking for this support to hold and provide GDXJ with a 15% bump back up to the $51 region.
There's a clear invalidation level just under $43 to provide a tight stop-loss and 5.6 R/R ratio.
This trade could take anywhere from 2-6 weeks to play out. Be patient and let it come to you.
The idea with this trade is simple. Buy at support and Sell at resistance.

