AGIX 12/04/20240.668 level is looking great. Our previous all time high level, i think price will create a range at that level. If we go down to make a deviation that would be great. It will indicate that we should enter our position. Let's wait for confirmations.
AGIXUSDT.P trade ideas


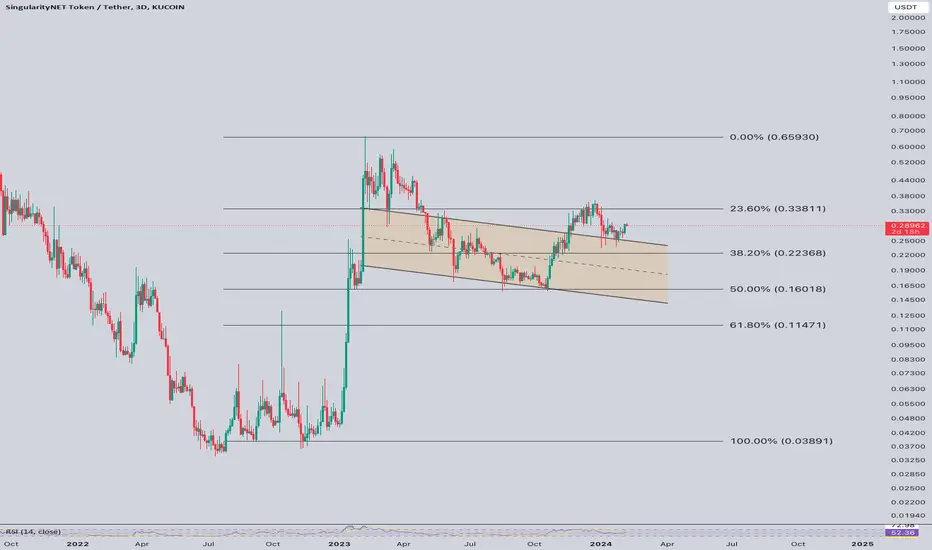
#AGIX looks bearishThis guy has formed bearish double top STF. The continuation is likely bearish in mid term. Not financial advice.

The bearish double top play out, but just how bearish is it?With the expected merger, the double top may just be an illusion as the other merging currencies do not have matching double tops.
Normally after a double top like this you would expect a long drawn out death.
But this is not your average situation.
The candle is entering an important zone here, we will be going neutral here unless btc wakes up before the halving.
If I was wiser with this set up I might just walk at first glance.
But my gut tells me there is at least one more alt season rally and the AI theme will play out big for those of us who take the risk.

AGIX 07/04/2024Price couldn't pass the all time high level. So i want price to go discount area. Where the circle is. This can create a good opportunity. Price now is in the premium area.
Another possible scenario is, price can win the WO and EQ level this will push the price RH. or it can possibly retest there, takes the liquidity above and goes to RL.

#AGIX/USDT#AGIX
The price is moving in a downward channel and adheres to it perfectly on the 4-hour frame, about to break to the upside
The area in green is a very strong support area from which the price rebounded at $1
We have a downtrend on the RSI indicator about to occur. The fraction is up
We have a higher stability moving average of 100
Entry price is 1.05
The first target is 1.145
The second goal is 1.25.
Third goal 1.38

AGIX: Cup & Handle Dream? Could AI Hype Fuel a $1+ Move?The AGIX/USD weekly chart shows an interesting development with a potential cup and handle pattern. This pattern, if confirmed, could technically indicate a move beyond $1. Hype surrounding AI doesn't guarantee success for individual projects. It's crucial to research AGIX's fundamentals, market conditions, and your own risk tolerance before investing. What are your thoughts on this potential pattern and the broader AI hype?

Approaching potential pre halving reversal zone.The decent is a little sharp, but with some sideways action we could run up as we approach or enter the cloud on the 1 day candles.

AGIX ANALYSIS🔮#AGIX Analysis : Pattern Formation 💰💰
📈 #AGIX is making perfect Double Top Pattern and also there is a breadown of trendlind. We can see a good dump in #AGIX. If #AGIX sustains this breakdown then we will see a bearish move🚀🚀
📊 Current Price: $1.08590
⏳ Target Price: $0.69057
⁉️ What to do?
- We can trade according to the chart and make some profits in #AGIX. Keep your eyes on the chart, observe trading volume and stay accustom to market moves.💲💲
#AGIX #Cryptocurrency #Pump #DYOR #Breakout

Looks like my initial thoughts on the 1 day were true.Any of the key zones on the 4 hr chart got destroyed and we will most likely be sinking lower before the next leg up

#AGIX/USDT breaks the diagonal Trendline in 4-Hour TF!#AGIX/USDT breaks the diagonal Trendline in 4-Hour TF!
SEED_DONKEYDAN_MARKET_CAP:AGIX needs to hold the $1.1665 support level to bounce back. In case of a successful retest, we can short #AGIXUSDT.
The next local support level is PWL $1.1015 and the local resistance level is PDL $1.255.

AGIX/USDT bullish reversal from support ? 👀🚀AGIX analysis💎Paradisers, let’s delve into the movement of #AGIXUSDT. Currently, it is retracing and retesting a critical support level at $1.17643. This level holds significant importance, and its ability to transition from a retest to a firm support could signal a potential bullish move.
💎 After successfully breaking out of a descending channel, the price of #AGIX is now approaching the key support level at $1.17643. If the price sustains its momentum at this level, we can expect a bullish reversal. With sustained upward momentum, the target lies above the strong resistance at $1.48693.
💎 However, should the price of SEED_DONKEYDAN_MARKET_CAP:AGIX dip below this pivotal zone, it’s crucial to adapt our strategy. We anticipate a bullish rebound from the secondary support level at $1.10437. Failing to regain ground here could potentially lead to further declines. Stay vigilant and agile as we navigate market fluctuations.

Despite the double top in my previous post Fetch doesn't matchWe are basically pegged to fetch, fetch AI has been an indicator for singularitynet this whole time and the prices have been moving mostly together,
Fetch didn't have a double top and is making a run up and because of the proposed merger despite the bearish indicators we have a solid candle forming here for a run up and Fetch is likely to carry us up as investors know we are basically pegged to fetch at a rate of .43332222 per coin.

alternate scenario if BTC rallies soon.My last chart overlayed on 4 hour candles with a potential other area we could pop off of.


AGIX/USDT Descending Wedge Formation and Elliott Wave AnalysisHello,
Having a close look at AGIX/USDT reveals an intriguing potential descending wedge pattern. Coupled with Elliott Wave principles, this offers a comprehensive perspective on the upcoming movements. The price trajectory has completed Waves 1, 2, and 3, with Wave 4 currently in progress. This suggests that upon its completion, we're likely to observe another leg down, Wave 5, before potentially witnessing a trend reversal.
As Wave 4 unfolds, it's poised to test an immediate resistance zone. Given the prevailing bearish sentiment and the strength of this resistance, it may prove challenging for the price to break through, pushing it further down as a result. Should the price action respect the boundaries of the descending wedge and the predictions of the Elliott Wave, we can anticipate a move downwards, marking the completion of Wave 5.
Once Wave 5 completes its trajectory, it is projected to fall into a drop target zone. This presents a strategic zone, highlighting an optimal area for medium-term coin accumulations with an upside target set at 0.4547, as marked on the chart.
As always, remember to implement appropriate stop-loss measures and trade responsibly.

BTC leads the road for AGIXBTC controls the market and it is pumping which is allowing AGIX to rally early, a new green cloud is forming and we are beginning to look very bullish in the short term.


Bullish on AGIX for wave 5Currently I am waiting for price to confirm wave 4 on Fibonacci in the target price 1-0.75$ starting with 21 march. I am using Fib ret. and fib time for confluences. RSI is too high right now for me to buy. Not financial advice

4HR candles bearish, 1 day candles way over extendedCorrection for the rest of the month by the looks, halving will save the day in April.

Bull run shows signs of continuing. Need to get into this zone so we are set for the moon shot after the halving.

AGIX goodAnother shitcoin I have no idea what it is but looks ready for the next round. Must be the future of AI or something.
Entering the cloudPast performance suggest that we will Pump up a little and trade sideways for some time.
