PPRICE ACTION Heiken candles read bullish but my candlestick formula reveals Super Bullish. Which also adds in advance what comes next which is the bullish no wicks candle and not seen on Heiken.
AERGOUSD trade ideas

AERGO LOOKS BULLISHYou should also note that this symbol is low-volume and highly volatile.
Before anything, pay attention to the time frame, the time frame is big and time consuming.
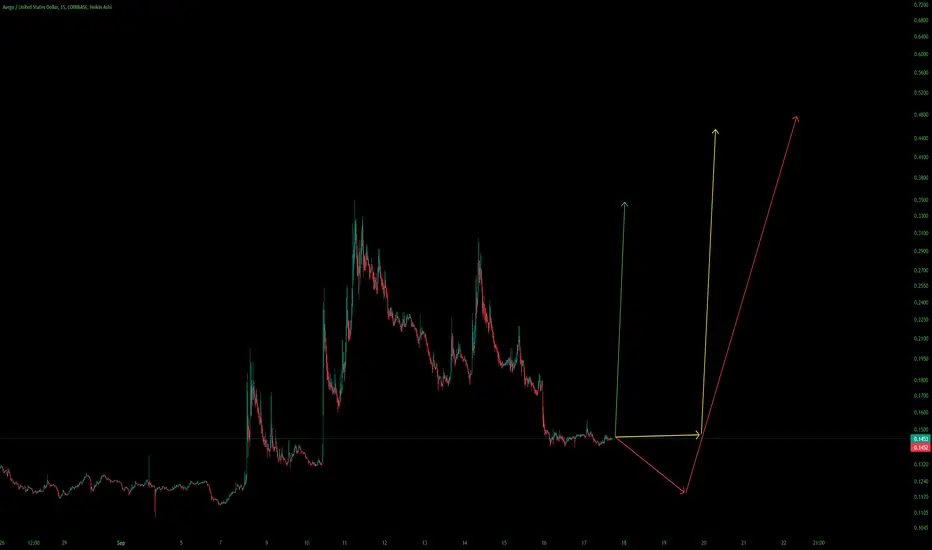
It seems that the B wave diametric is ending and the price is now in the G wave which is the last wave of this diametric.
It can go up while maintaining the green range.
Closing a weekly candle below the invalidation level will violate the analysis.
For risk management, please don't forget stop loss and capital management
When we reach the first target, save some profit and then change the stop to entry
Comment if you have any questions
Thank You

LONG for AERGOAccording to our advanced AI prediction model, AERGO is anticipated to experience an upward trajectory. The model, leveraging intricate algorithms and extensive data analysis, suggests positive market dynamics for AERGO in the near future. Investors and enthusiasts may find confidence in the forecasted upward movement, but it's essential to conduct thorough research and consider multiple factors before making financial decisions. Always exercise due diligence and stay informed for prudent investment strategies. 🚀💡 #AERGO #AIprediction #MarketAnalysis

Harmonic SHARK Target 1 & 2 hold hands together with price cloud. SHARK with a positive uptrend confirmation because of shark harmonic. Added pitchfork for guidance. AERGO is ready.
Advised to do your own research and seek financial advice, anything I say and write out is for my own prediction and own entertainment.

AERGO Rising WedgeGot news for you: AERGO's not the only token trending in a RW pattern. There are many others. Upper shadows are long and deep above microtrend resistance, volume is relatively low on the upthrusts. Blood is on the forecast, but perhaps not before another bull trap rally. Don't get fooled by the FOMO. Stay safe!
Be sure to subscribe for more clean, accurate, easy-to-follow swing charts with exceptionally high win ratios (80-85% average). I'm a fulltime crypto trader/investor and I handpick all the runners myself after conducting a series of volume-to-spread reads and Wyckoff schematic comparisons.
Not financial advice. Always DYOR & trade at your own risk.

what trend will happen next?Holding and waiting to see what happens next.
I honestly don't know what is going to happen.
Regardless of what is to come i will continue to hold and buy.
Indicators are not giving accurate information compared with the market trends on many cryptocurrencies.
Hit and miss but on a macro scale moving forward hold or fold is an individuals decision to make.
No more posts for awhile.
no resistance just repetitive small buysYes traders, the market price has dropped some however the buy orders are constant and small. This tells me that my analysis was correct.
Small buy order accumulation and a big bullish move up is coming.
watching and buying is my strategy for the moment.
regardless of price movement i am buying and building my portfolio. the more tokens MORE GAINS...
short squeeze will happen when your asleep eating or paying attention to your kids. LOL

Aergo Holders be on standby for rallyI've been watching closely for some time now.
Strong buys are coming and i think its happening in 8 to 12 hours.
The trick is don't buy too much at one time. Spread out over 100 to 200 buy orders without using order books.
Order books are manipulated to confuse you. Stick to your strategy that works and follow the trend.
There is two possibilities here. Either the bullish trend will curve up or squeeze during a 30 min trade.
I have secured my trade and buying small to build up my holdings.
patiently waiting and accumulating.
more volume the better so be ready for anything to happen.
bullish wave coming...

Aergo (AERGO) - July 11Hello?
Traders, welcome.
By "following", you can always get new information quickly.
Please also click "Like".
Have a good day.
-------------------------------------
(AERGOUSD 1W Chart)
The key is whether it can find support at 0.16029916 and move higher than 0.20774306.
If not, you should check to see if it is supported near 0.10313975.
(1D chart)
It is located in the 0.14295967-0.16029916 section after the surge.
If support is found in the 0.14295967-0.16029916 zone and moves up, I expect it to touch the 0.20774306 point.
Otherwise, it is expected to decline near the 0.10313975-0.11893989 section.
To see if this surge was a move to turn into an uptrend, we need to see if there is support near 0.14295967.
However, you should observe the movement as it can create a pull back pattern.
------------------------------------------------------------ -----------------------------------------------------
** All indicators are lagging indicators.
Therefore, it is important to be aware that the indicator moves accordingly with the movement of price and volume.
However, for the sake of convenience, we are talking in reverse for the interpretation of the indicator.
** The MRHAB-T indicator used in the chart is an indicator of our channel that has not been released yet.
** The OBV indicator was re-created by applying a formula to the DepthHouse Trading indicator, an indicator disclosed by oh92. (Thanks for this.)
** Support or resistance is based on the closing price of the 1D chart.
** All descriptions are for reference only and do not guarantee a profit or loss in investment.
(Short-term Stop Loss can be said to be a point where profit and loss can be preserved or additional entry can be made through split trading. It is a short-term investment perspective.)
---------------------------------

AERGO RisingAergo/USD is rising among the numbers and is one of the latest preliminaries sent to the group at .1250. Here we are now at .1278 and things are still looking good. I'm cashing out somewhere between the .618 and 2.0% Fib. Every little bit counts in this countertrend, but please be careful: look for more surprise pullback action with BTC. We're not out of the woods yet.
*If you like making money, be sure to subscribe for more dynamic & easy-to-follow Wyckoff/VSA swing charts with win ratios averaging between 80-85% in hitting the profit zones. Check my past charts, then follow me and see for yourself that I'm all about making money; it's the only reason I'm here, and I want you to make money too! (Because it makes me look good). Let's go!
**Not financial advice. Please DYOR and trade at your own risk.


AERGO pullback completeAergo went up doubled in price now is down again, as usual with alt coins
This can chill for a while gather momentum and go to the target or beyond
Is a good idea ,most of the times , to buy this kind of pullbacks, in a bull market
This is not financial advice
Just an idea...
We could see ( bellow ) AERGO had triple top before it gave up breaking resistance ,and returned home
