BTCUSDT 4H | Bitcoin market overview: Triangle
Hello, dear subscribers!
In the previous review, we looked at the decline in volatility in the bitcoin market, as well as bulls and bears targets.
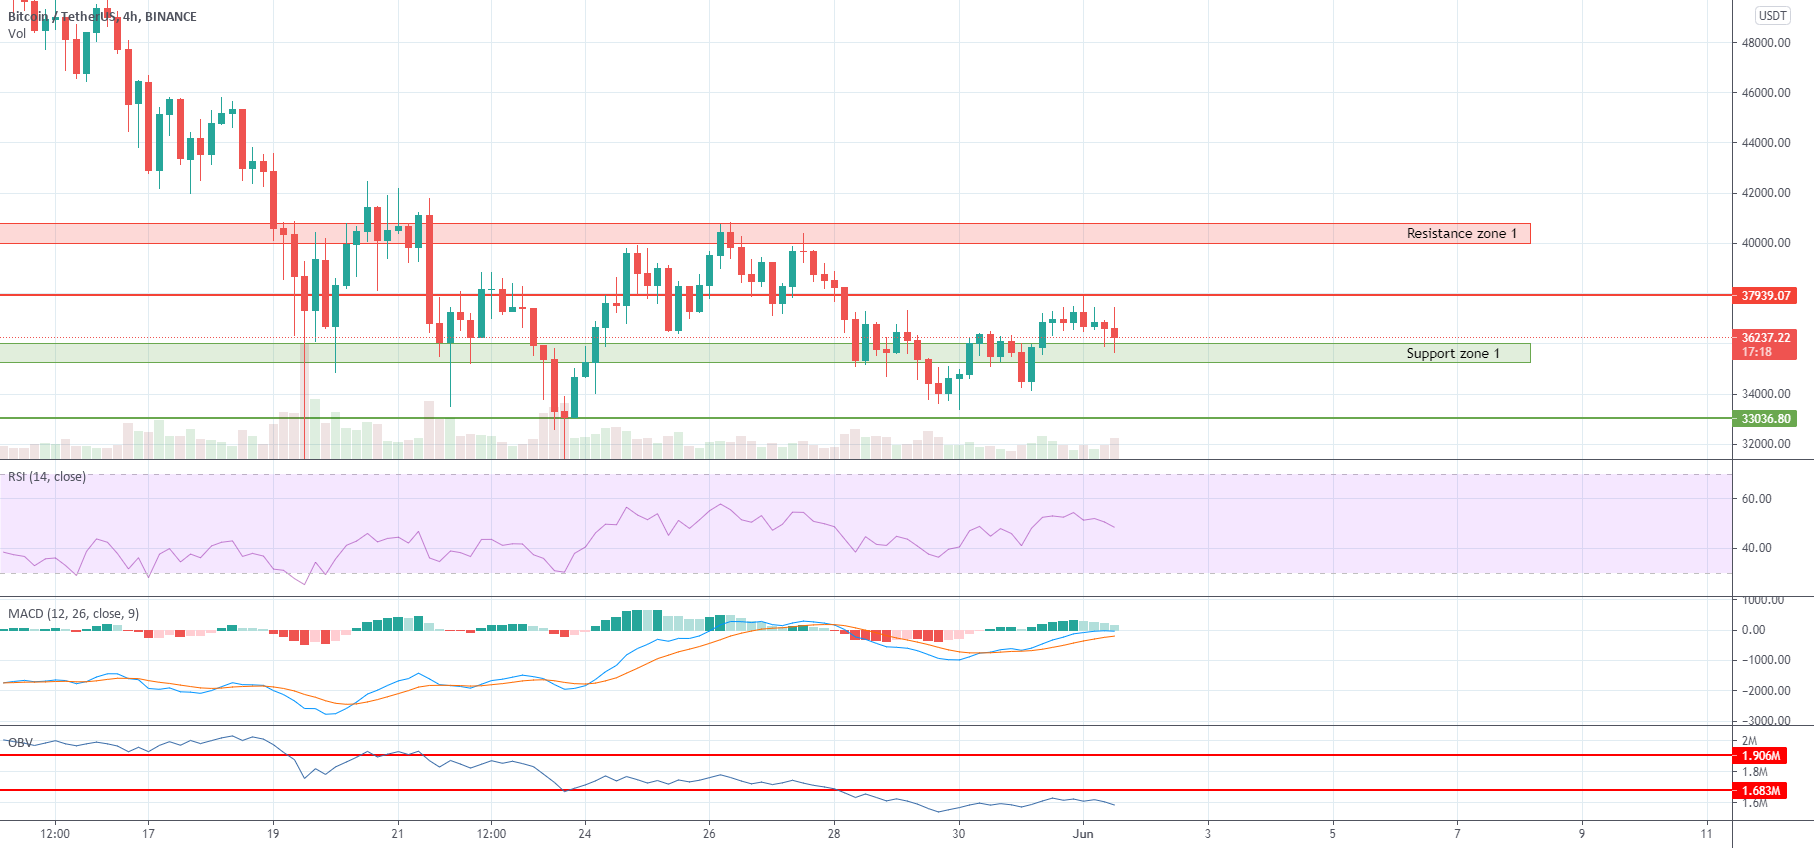
 Since then, the bulls have attempted to consolidate above $38,000, but they have not been able to stay above it for long. Bitcoin's current price is $36,500 to $37,000 and it has fallen back into the $36,000 to $38,000 uncertainty zone. After a massive drop to $30,000, the bitcoin price is moving within a large correctional triangle. According to the theory of technical analysis, the triangle formed after the fall is more likely to continue falling again. But in order to do that, bitcoin price needs to break through the lower boundary of the triangle.
MACD and RSI indicators indicate growing bearish dominance in the market. The OBV indicator is between support 1.4M and resistance 1.7M. These values are targets for bulls and bears respectively.
Subscribe to the channel and stay tuned!
In the previous review, we looked at the decline in volatility in the bitcoin market, as well as bulls and bears targets.
MACD and RSI indicators indicate growing bearish dominance in the market. The OBV indicator is between support 1.4M and resistance 1.7M. These values are targets for bulls and bears respectively.
Subscribe to the channel and stay tuned!