Hey here is Technical Patterns cheat sheet for traders.
🖨 Every trader must print this cheatsheet and keep it on the desk 👍
🖼 Printable picture below (Right click > Save Image As…)

In finance, technical analysis is an analysis methodology for forecasting the direction of prices through the study of past market data, primarily price and volume.
Behavioral economics and quantitative analysis use many of the same tools of technical analysis, which, being an aspect of active management, stands in contradiction to much of modern portfolio theory. The efficacy of both technical and fundamental analysis is disputed by the efficient-market hypothesis, which states that stock market prices are essentially unpredictable, and research on whether technical analysis offers any benefit has produced mixed results. As such it has been described by many academics as pseudoscience.
Fundamental analysts examine earnings, dividends, assets, quality, ratio, new products, research and the like. Technicians employ many methods, tools and techniques as well, one of which is the use of charts. Using charts, technical analysts seek to identify price patterns and market trends in financial markets and attempt to exploit those patterns.
Technicians using charts search for archetypal price chart patterns, such as the well-known head and shoulders or double top/bottom reversal patterns, study technical indicators, moving averages and look for forms such as lines of support, resistance, channels and more obscure formations such as flags, pennants, balance days and cup and handle patterns.
Technical analysts also widely use market indicators of many sorts, some of which are mathematical transformations of price, often including up and down volume, advance/decline data and other inputs. These indicators are used to help assess whether an asset is trending, and if it is, the probability of its direction and of continuation. Technicians also look for relationships between price/volume indices and market indicators. Examples include the moving average, relative strength index and MACD. Other avenues of study include correlations between changes in Options (implied volatility) and put/call ratios with price. Also important are sentiment indicators such as Put/Call ratios, bull/bear ratios, short interest, Implied Volatility, etc.
There are many techniques in technical analysis. Adherents of different techniques (for example: Candlestick analysis, the oldest form of technical analysis developed by a Japanese grain trader; Harmonics; Dow theory; and Elliott wave theory) may ignore the other approaches, yet many traders combine elements from more than one technique. Some technical analysts use subjective judgment to decide which pattern(s) a particular instrument reflects at a given time and what the interpretation of that pattern should be. Others employ a strictly mechanical or systematic approach to pattern identification and interpretation.
Contrasting with technical analysis is fundamental analysis, the study of economic factors that influence the way investors price financial markets. Technical analysis holds that prices already reflect all the underlying fundamental factors. Uncovering the trends is what technical indicators are designed to do, although neither technical nor fundamental indicators are perfect. Some traders use technical or fundamental analysis exclusively, while others use both types to make trading decisions.
Best regards
Artem Shevelev
🖨 Every trader must print this cheatsheet and keep it on the desk 👍
🖼 Printable picture below (Right click > Save Image As…)
In finance, technical analysis is an analysis methodology for forecasting the direction of prices through the study of past market data, primarily price and volume.
Behavioral economics and quantitative analysis use many of the same tools of technical analysis, which, being an aspect of active management, stands in contradiction to much of modern portfolio theory. The efficacy of both technical and fundamental analysis is disputed by the efficient-market hypothesis, which states that stock market prices are essentially unpredictable, and research on whether technical analysis offers any benefit has produced mixed results. As such it has been described by many academics as pseudoscience.
Fundamental analysts examine earnings, dividends, assets, quality, ratio, new products, research and the like. Technicians employ many methods, tools and techniques as well, one of which is the use of charts. Using charts, technical analysts seek to identify price patterns and market trends in financial markets and attempt to exploit those patterns.
Technicians using charts search for archetypal price chart patterns, such as the well-known head and shoulders or double top/bottom reversal patterns, study technical indicators, moving averages and look for forms such as lines of support, resistance, channels and more obscure formations such as flags, pennants, balance days and cup and handle patterns.
Technical analysts also widely use market indicators of many sorts, some of which are mathematical transformations of price, often including up and down volume, advance/decline data and other inputs. These indicators are used to help assess whether an asset is trending, and if it is, the probability of its direction and of continuation. Technicians also look for relationships between price/volume indices and market indicators. Examples include the moving average, relative strength index and MACD. Other avenues of study include correlations between changes in Options (implied volatility) and put/call ratios with price. Also important are sentiment indicators such as Put/Call ratios, bull/bear ratios, short interest, Implied Volatility, etc.
There are many techniques in technical analysis. Adherents of different techniques (for example: Candlestick analysis, the oldest form of technical analysis developed by a Japanese grain trader; Harmonics; Dow theory; and Elliott wave theory) may ignore the other approaches, yet many traders combine elements from more than one technique. Some technical analysts use subjective judgment to decide which pattern(s) a particular instrument reflects at a given time and what the interpretation of that pattern should be. Others employ a strictly mechanical or systematic approach to pattern identification and interpretation.
Contrasting with technical analysis is fundamental analysis, the study of economic factors that influence the way investors price financial markets. Technical analysis holds that prices already reflect all the underlying fundamental factors. Uncovering the trends is what technical indicators are designed to do, although neither technical nor fundamental indicators are perfect. Some traders use technical or fundamental analysis exclusively, while others use both types to make trading decisions.
Best regards
Artem Shevelev
Comment:
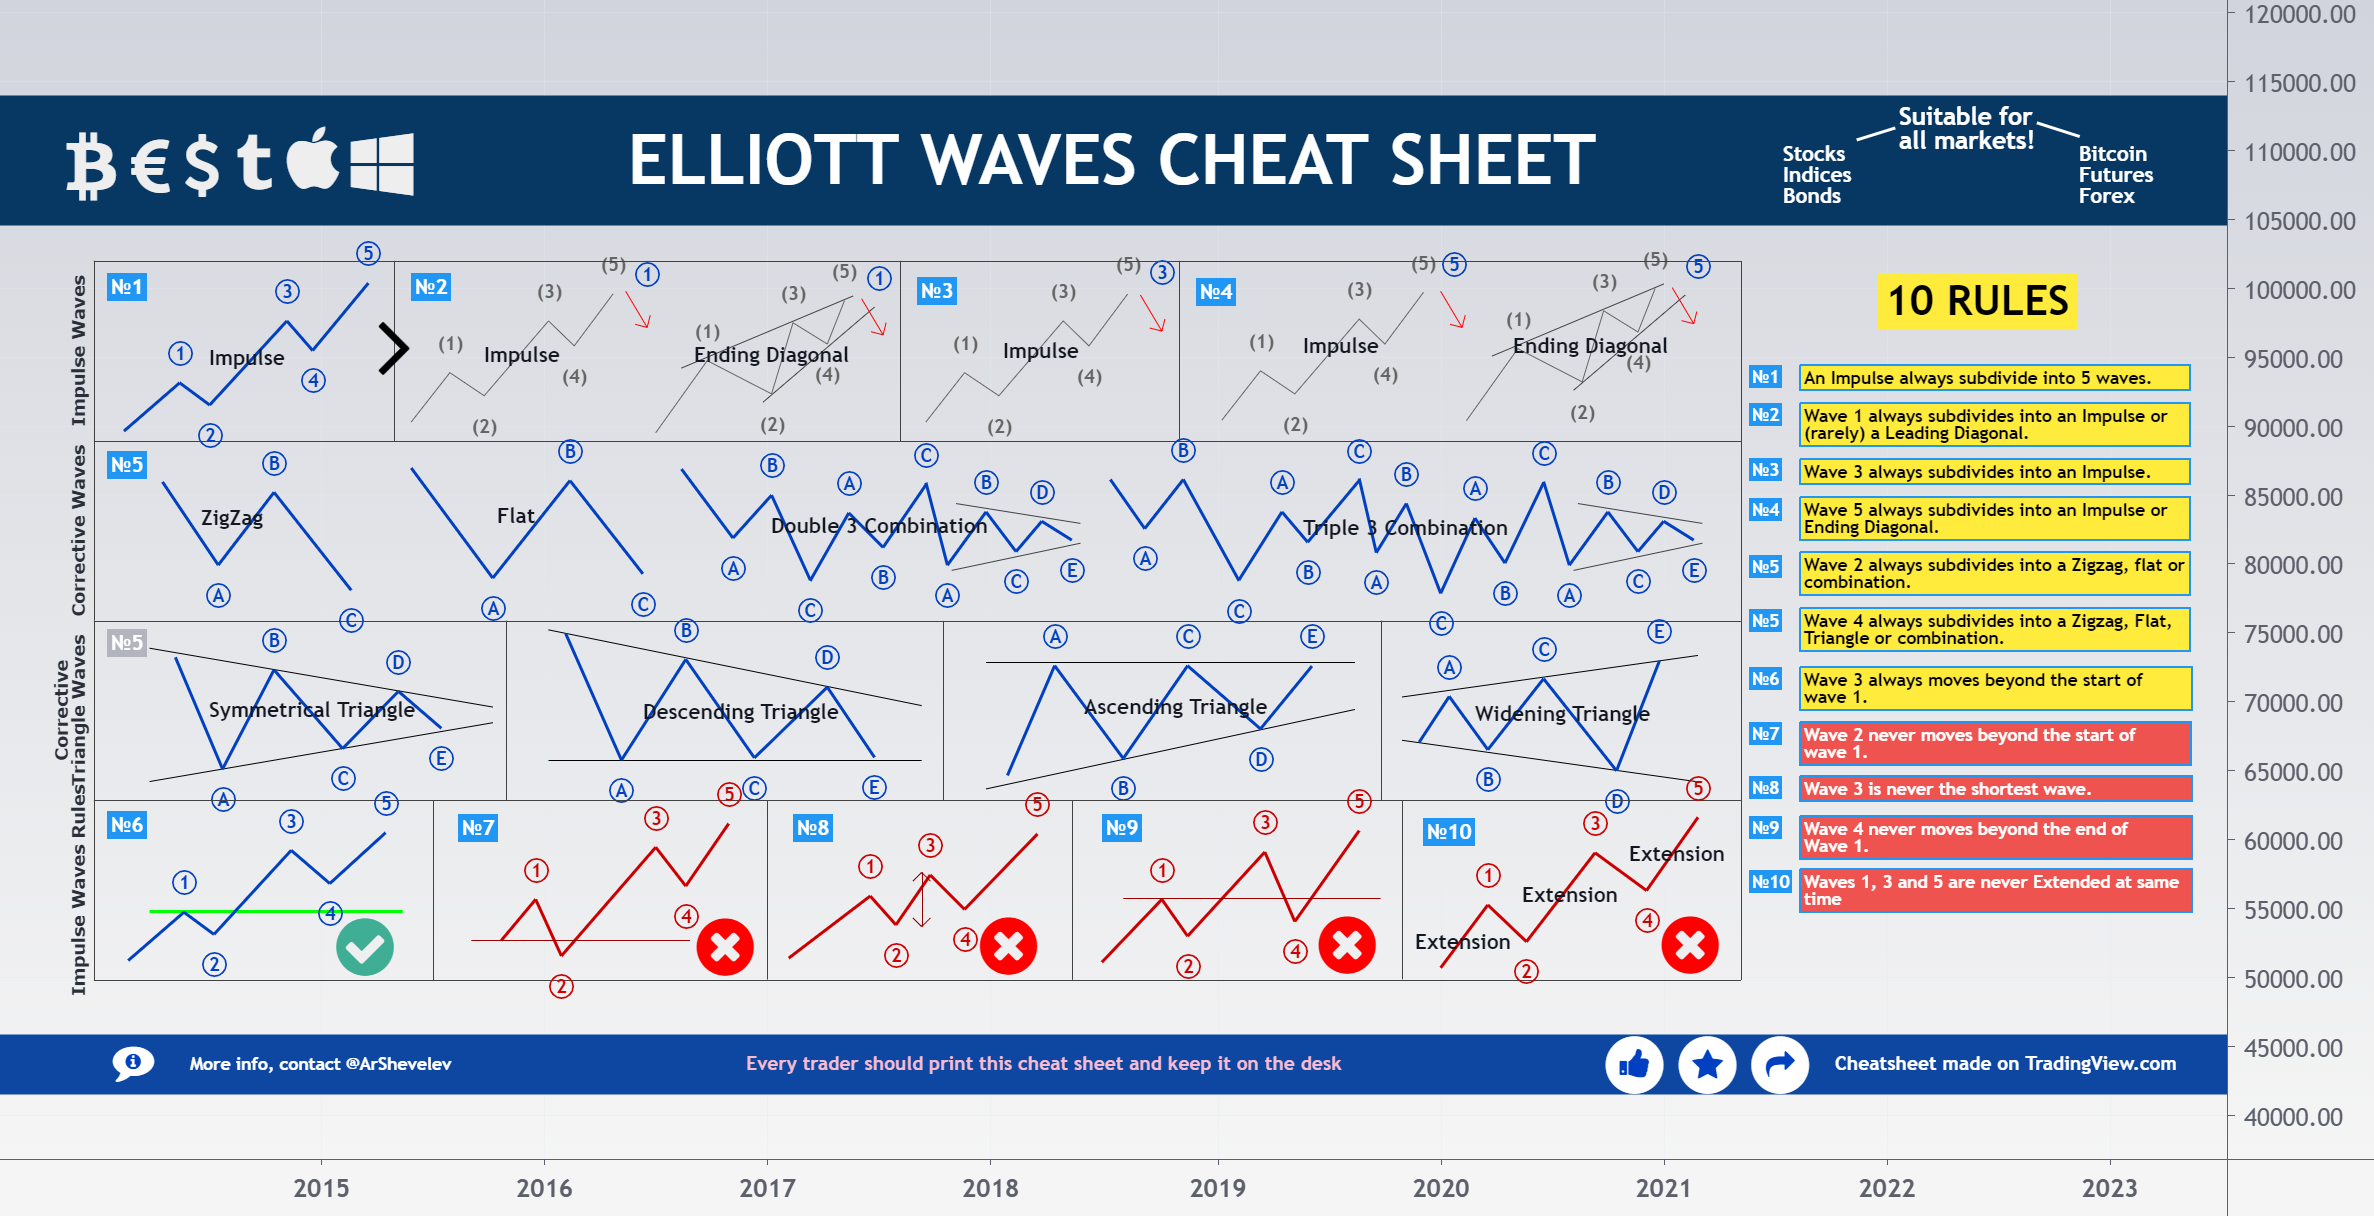
ELLIOTT WAVES CHEAT SHEET 🏄♂️ 10 Rules
Trade active:
Top 20 trading patterns cheat sheet
Comment:
Livermore Cylinders are so popular on crypto charts rn!
Comment:
Always helpful
🔵 🟡 𝗙𝗥𝗘𝗘 & 𝗣𝗥𝗘𝗠𝗜𝗨𝗠 𝗜𝗻𝘀𝗶𝗴𝗵𝘁𝘀: t.me/+5hlxWmhHaKplN2Rk
Enjoying the content? Here's a free way to show your support!
Sign Up and get Special Bonuses:
🔵 toobit.com/t/ArShevelev 🔵
🟡 bybit.com/b/ArShevelev 🟡
Enjoying the content? Here's a free way to show your support!
Sign Up and get Special Bonuses:
🔵 toobit.com/t/ArShevelev 🔵
🟡 bybit.com/b/ArShevelev 🟡