XRPETH trade ideas


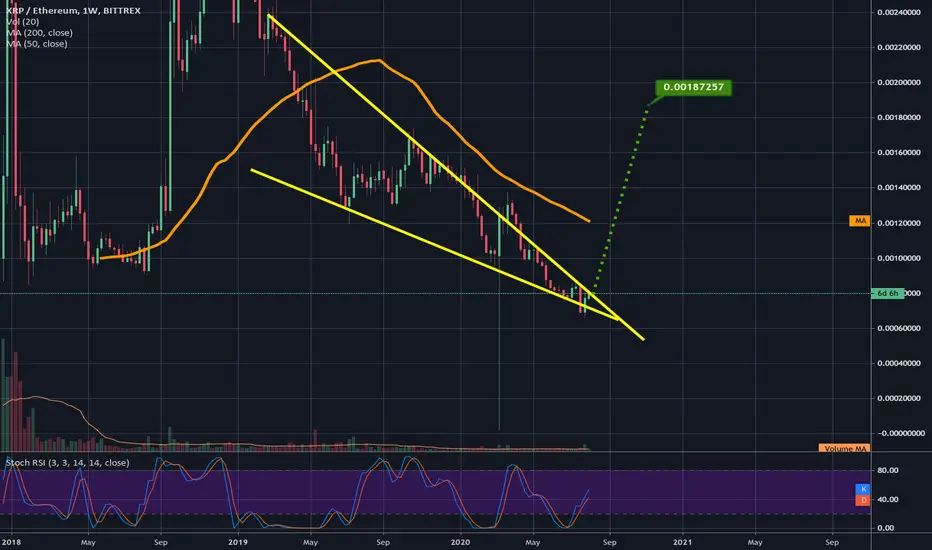
XRP set to gain 50% against eth based on XRPETH falling wedgemeasured move still has 49-50% more to climb to its measured move breakout target...could continue to gain ground after that as well.


XRP to ETH Price Relativity - We have bottomed!This is a weekly view on XRPETH.
The golden circles show points we have touched the 0.00085 level as either resistance or support. We just touched this area as support. I firmly believe this relativity zone will hold as support.
This implies that XRP's price in relation to Ethereum has bottomed. Meaning, XRPUSD will increase in value greater as ETHUSD value increases. (i.e. we shall see higher price appreciation in XRP vs. ETH)
XRPETH has been another data point I have been using to understand how under-valued we are relative to the market.
I also plan to use this chart moving forward to help bring clarity on when may be a good time to scale out of XRP as it becomes over-valued relative to the market.
XRP and ETH have swapped the #2 and #3 market cap spots historically.
What this chart clearly displays is currently XRP is extremely undervalued relative to ETH based upon historical price points.
I fully expect we catch up to historical values between the 0.5 - 0.702 fib retracement levels shown here.
Also, I am expecting this upcoming bull cycle to exceed prior ATH XRPETH valuations and approach the 1.618 fib extension shown in blue (w/rocket ship to further drive this point home!).
I enjoy sharing factual, realistic analysis on XRP given both that it is so hated in the community and because of all the hype artists in the space.
Best of luck!

A TREND CHANGE IN PLAYAs it could be seen, a break above the falling channel implies a trend change. After some consolidation, the pair is expected to rise.

CHANCE FOR A SELL According to the chart, after a short rise, there would be a chance to sell the pair as it hits the upper line of the falling channel. If this analysis was interesting for you, please support us with your warm likes. Thanks

XRP/ETH is trying againNo reaction after the break of the resistance
Trending RSI
See the first analyse in the linked ideas

Stillw atching the XRPETH falling wedge.I anticipate a breakout within the next couple weeks...this is how the wedge looks on kucoins weekly chart:


xrpeth ripple diving deeper in compare to ethereumRipple further losing his value against ethereum and is almost at same lows price as like two years ago.

XRP to make gains over ETH over the next weekThe RSA, The EMI (100) and MACD all point at XRP making gains over ETH over the next week
The next target, (from the current position), is 0.00085 in the next 10 days.
But if we go down to the next level of resistance, ( <0.00069) then the target will not be reached until the end of the month.
The good news is that both coins are valuable so holding either XRP or ETH is a valuable option.
Also, ETHBTC looks like it is weakening so I would start the trade now even if there is a chance of further losses in the short term.

Falling wedge on XRPETH suggests 130-140% gains for XRPLooking at the weekly chart here we can see the XRPETH chart is reaching the apex of a falling wedge its been in for quite some time. Should this see a bullish breakout upward we could see XRP make 130-140% gains against ethereum based on the measured move for the wedge. This pair's chart can be harder to predict than normal usd, btc, or tether paired charts but on the 1 day chart xrpeth is currently holding support above the 1 day 50ma. If it can maintain that support then we should see a bullish breakout from the wedge. We must keep in mind that often wedge breakouts only reach 60% of the measured move, but I've also seen plenty of wedges reach their exact targets and quite a few exceeding those targets as well and considering we are just now seeing the bull market begin it should increase the likelihood of this pattern reaching its target. Also XRPUSD is days away from the golden cross to put it in an official bull market which lines up pretty well confluence wise with where this wedge pattern would break upward.

Wanna have 10x more ETH? Buy XRP!Here's a better chart:
charts.cointrader.pro
So you're bullish on ETH?
Defi will lead the way for the next bull market?!
You're an emotionless market participant and want to make money?
Then maybe you should drop ETH and buy some XRP!
As you can see in the weekly XRPETH chart, several bullish divergences we're already building and playing out nicely for XRP.
Most moves we're violent and quick favouring XRP and this time won't be any different.
The MACD histogram broke out of the downtrend, tested the downward sloping trendline and is now trending towards 0 with a high chance of getting over it.
In worst case, we'll reject a 7th time at the top of the symetrical triangle, which is a 140% gain compared to ETH.
In best case, we'll breakout of the triangle and the fomo is real!
I see only a small chance for the triangle to break to the downside favouring ETH, because XRP managed to work its way up from March 2017 untill now and kind of build an ascending triangle, which can still break to the upside!
Around the price of 0.00063 I would consider ETH to be the winner. In this case I would favor to have some bigger bags of ETH, but untill then, indicator wise its probably smarter to have a good chunk of XRP!
What do you think of this analysis? Please comment down below! Thx!
I'm not a financial advisor, this is for entertainment purposes only :)

XRPETH might make some ripples!XRPETH looks extremely similar to LTCETH right now. I've been watching and waiting for these levels for years. Critical buy and sell price targets are marked on the chart. The price action right now looks like a bear trap. I am betting on a quick rise back into the channel and a touch of nearby sell targets, but am also leaving capital on the side ready for lower buy targets. Let's see what happens!
