Box on $SPGIThe hourly chart shows a bullish test of the ema 21/50 with a big box going on into the range $418-$441
An action higher would create a positive price action
Next report date
Report period
Q2 2024
EPS estimate
3.25EUR
Revenue estimate
3.10 BEUR
7.45EUR
2.38 BEUR
11.32 BEUR
319.85 M
About S&P Global Inc.
Sector
Industry
CEO
Douglas L. Peterson
Website
Headquarters
New York
Employees (FY)
40.45 K
Founded
1917
FIGI
BBG000JKSHV2
S&P Global, Inc. engages in the provision of transparent and independent ratings, benchmarks, analytics, and data to the capital and commodity markets worldwide. It operates through the following segments: Market Intelligence, Ratings, Commodity Insights, Mobility, Indices, and Engineering Solutions. The Market Intelligence segment provides multi-asset-class data and analytics integrated with purpose-built workflow solutions. The Ratings segment is involved in credit ratings, research, and analytics, offering investors and other market participants information, ratings, and benchmarks. The Commodity Insights segment focuses on information and benchmark prices for the commodity and energy markets. The Mobility segment offers solutions serving the full automotive value chain including vehicle manufacturers, automotive suppliers, mobility service providers, retailers, consumers, and finance and insurance companies. The Engineering Solutions segment engages in advanced knowledge discovery technologies, research tools, and software-based engineering decision engines to advance innovation, maximize productivity, improve quality, and reduce risk. The company was founded by James H. McGraw and John A. Hill in 1917 and is headquartered in New York, NY.

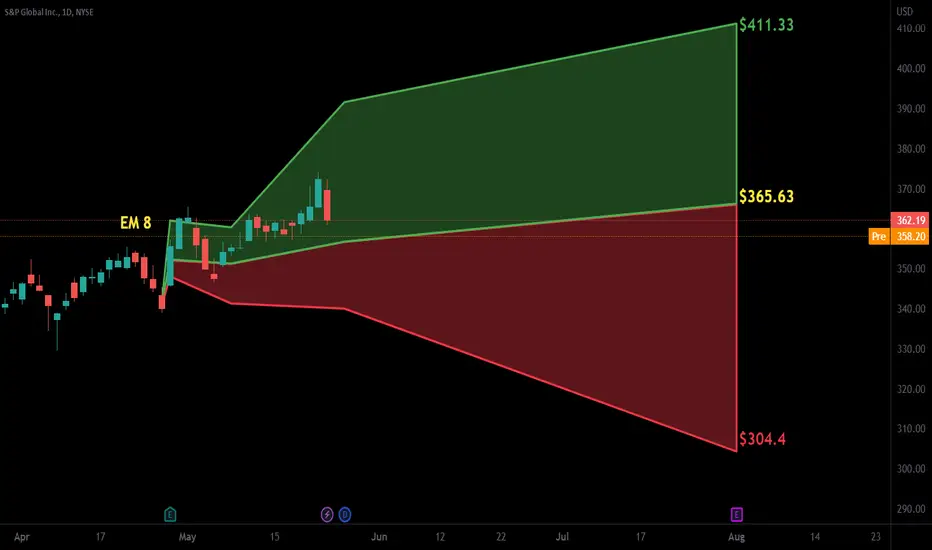
SPGI - WeeklySPGI- currently down 28% from the ATH, and still in its downtrend.
Has reached and held support at 327. Might see another touch of 327 before attempt to change the trend by gaining yellow (360.55)
Targets in orange if 360.55 is gained as support.
If support is lost then targeting below in cyan.

$SPGI with a bearish outlook following its earnings #StocksThe PEAD projected a bearish outlook for NYSE:SPGI after a negative under reaction following its earnings release placing the stock in drift D .

SPGI S&P GLOBALA fantastic chart on which the head and shoulders pattern was formed. The price is at the level of 0.5 fibo. The goals of working out the pattern on the chart.

New addition to my portfolioI have just added SPGI to my portfolio
S&P Global Inc. provides credit ratings, benchmarks, analytics, and workflow solutions in the global capital, commodity, and automotive markets

$SPGI with a bullish outlook following its earnings #StocksThe PEAD projected a bullish outlook for NYSE:SPGI after a positive under reaction following its earnings release placing the stock in drift A with an expected accuracy of 60%.
SPGI - Bear ThoughtsHaving thoughts about a bearish move on SPGI
We have already seen a strong top now its just a matter of time before the second one arises and we see a double top.
Bearish bars pattern continuing the bear trend line.

$SPGI with a bullish outlook following its earnings #StocksThe PEAD projected a bullish outlook for $SPGI after a positive over reaction following its earnings release placing the stock in drift B with an expected accuracy of 50%.
SPGI. LONG IDEA.2ND stock trading idea!!
Open = 360.00
Target/TP = 390.00
SL= 350.00
Opening level = 360.00 Marks the Beginning for a possible bullish trend (primary/starting level)
Closing level = 390.00 A key level in the overall trend.
(THIS IDEA IS MAINLY BASED ON TECHNICALS)
(this is a personal idea based

Descending Broadening Wedge Breakout into DivvyDescending Broadening Wedge Breakout into Divvy
wait for old resistance to become support for entry play into next supply zone

See all ideas
Trade directly on the supercharts through our supported, fully-verified and user-reviewed brokers.


Frequently Asked Questions
The current price of MHL is 383.15 EUR — it has decreased by 0.76% in the past 24 hours.
Depending on the exchange, the stock ticker may vary. For instance, on XETR exchange S&P GLOBAL INC stocks are traded under the ticker MHL.
S&P GLOBAL INC is going to release the next earnings report on Jul 30, 2024. Keep track of upcoming events with our Earnings Calendar.
MHL stock is 2.68% volatile and has beta coefficient of 1.29. Check out the list of the most volatile stocks — is S&P GLOBAL INC there?
MHL earnings for the last quarter are 2.84 EUR per share, whereas the estimation was 2.85 EUR resulting in a −0.50% surprise. The estimated earnings for the next quarter are 3.39 EUR per share. See more details about S&P GLOBAL INC earnings.
S&P GLOBAL INC revenue for the last quarter amounts to 2.86 B EUR despite the estimated figure of 2.84 B EUR. In the next quarter revenue is expected to reach 3.16 B EUR.
Yes, you can track S&P GLOBAL INC financials in yearly and quarterly reports right on TradingView.
MHL stock has fallen by 0.49% compared to the previous week, the month change is a 1.12% fall, over the last year S&P GLOBAL INC has showed a 22.69% increase.
MHL net income for the last quarter is 524.58 M EUR, while the quarter before that showed 701.93 M EUR of net income which accounts for −25.27% change. Track more S&P GLOBAL INC financial stats to get the full picture.
Today S&P GLOBAL INC has the market capitalization of 124.05 B, it has increased by 1.73% over the last week.
Yes, MHL dividends are paid quarterly. The last dividend per share was 0.84 EUR. As of today, Dividend Yield (TTM)% is 0.87%. Tracking S&P GLOBAL INC dividends might help you take more informed decisions.
S&P GLOBAL INC dividend yield was 0.82% in 2023, and payout ratio reached 43.72%. The year before the numbers were 0.99% and 32.56% correspondingly. See high-dividend stocks and find more opportunities for your portfolio.
Like other stocks, MHL shares are traded on stock exchanges, e.g. Nasdaq, Nyse, Euronext, and the easiest way to buy them is through an online stock broker. To do this, you need to open an account and follow a broker's procedures, then start trading. You can trade S&P GLOBAL INC stock right from TradingView charts — choose your broker and connect to your account.
As of Apr 26, 2024, the company has 40.45 K employees. See our rating of the largest employees — is S&P GLOBAL INC on this list?
Investing in stocks requires a comprehensive research: you should carefully study all the available data, e.g. company's financials, related news, and its technical analysis. So S&P GLOBAL INC technincal analysis shows the sell today, and its 1 week rating is neutral. Since market conditions are prone to changes, it's worth looking a bit further into the future — according to the 1 month rating S&P GLOBAL INC stock shows the buy signal. See more of S&P GLOBAL INC technicals for a more comprehensive analysis.
If you're still not sure, try looking for inspiration in our curated watchlists.
If you're still not sure, try looking for inspiration in our curated watchlists.
We've gathered analysts' opinions on S&P GLOBAL INC future price: according to them, MHL price has a max estimate of 501.91 EUR and a min estimate of 410.18 EUR. Read a more detailed S&P GLOBAL INC forecast: see what analysts think of S&P GLOBAL INC and suggest that you do with its stocks.
EBITDA measures a company's operating performance, its growth signifies an improvement in the efficiency of a company. S&P GLOBAL INC EBITDA is 4.88 B EUR, and current EBITDA margin is 45.09%. See more stats in S&P GLOBAL INC financial statements.