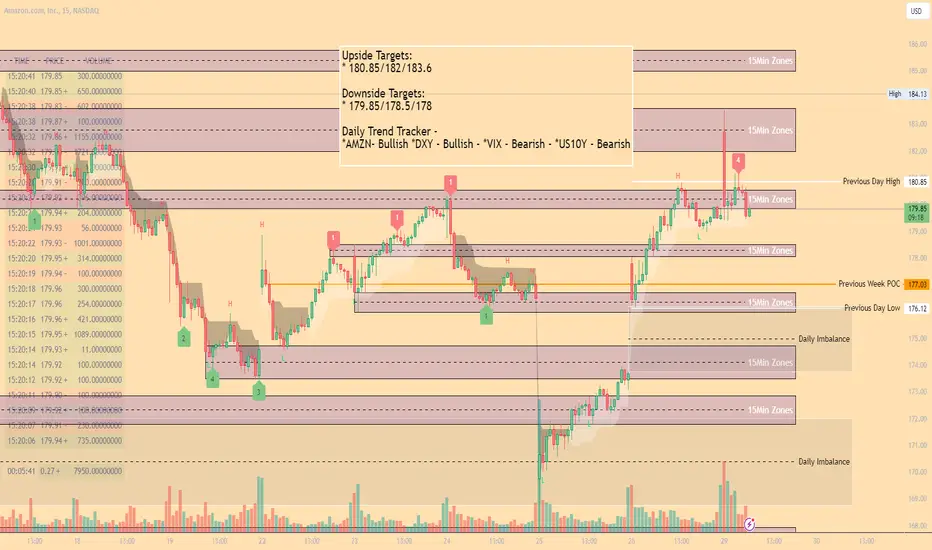
AMZN Mid Day Scalping Zones 4/29Upside Targets:
* 180.85/182/183.6
Downside Targets:
* 179.85/178.5/178
Daily Trend Tracker -
*AMZN- Bullish *DXY - Bullish - *VIX - Bearish - *US10Y - Bearish
AMZ trade ideas
What Are Cyclical Stocks?What Are Cyclical Stocks?
Cyclical stocks are well known for ebbing and flowing with the rhythm of the economy. These stocks, a reflection of economic trends, demand a keen understanding of how various sectors react to changing economic conditions. This article delves into the world of cyclical stocks, offering insights into their nature, impact, and strategies for navigating their unique challenges and opportunities in the financial markets.
What Is a Cyclical Stock?
The cyclical stocks definition refers to shares of companies whose performance closely aligns with the economic cycle. They thrive as the economy booms but often underperform in recessions.
Unlike counter-cyclical stocks, which tend to be stable or even prosper during economic downturns, cyclical stocks mirror the highs and lows of the economy. Industries like travel, automotive, and luxury goods are typical examples where price performance is directly tied to consumer spending and the health of the economy.
Characteristics of Cyclical Stocks
Cyclical stocks are distinguished by a set of defining characteristics. Primarily, they exhibit high volatility in response to economic changes. When the economy is growing, they often see significant gains as consumer confidence and spending increase. Conversely, during economic downturns, they often experience steep declines.
The revenues and profits of these companies are closely tied to economic activities. For instance, in a booming economy, the automotive sector might see increased sales, boosting the value of car manufacturers. Sector-specific sensitivity is a critical aspect of cyclical stocks, meaning investors and traders must be adept at interpreting economic indicators to analyse performance trends.
Another key feature is their correlation with consumer behaviour. Cyclical growth stocks typically see fluctuating demand based on consumer confidence and disposable income, directly impacting the values of companies in these industries.
Cyclical Stocks Examples
Cyclical stocks encompass a variety of industries that are highly sensitive to the economic cycle.
Automotive: Companies like Ford and Toyota. Sales in the automotive sector often rise with economic growth, as consumers are more likely to purchase vehicles.
Consumer Discretionary: Retail giants such as Amazon and Nike. These securities depend on consumer spending, which fluctuates with economic conditions.
Travel and Leisure: Airlines like Delta and hotel chains such as Marriott. Travel spending is typically high during economic booms and drops during recessions.
Construction and Housing: Homebuilders like D.R. Horton and Lowe's. Housing market growth is directly linked to the economy, influencing construction activity and home improvement spending.
Luxury Goods: Brands like Louis Vuitton and Rolex. Luxury purchases increase with rising consumer wealth in strong economies.
Economic Indicators and Cyclical Stocks
Economic indicators play a pivotal role in the performance of cyclical stocks. Key indicators such as Gross Domestic Product (GDP), employment rates, and consumer confidence indices offer insights into the health of the economy, which in turn influences these stocks.
For example, a rise in GDP often signals growth, leading to increased consumer spending and higher corporate earnings, positively impacting this class of stocks. Similarly, low unemployment rates boost consumer confidence and spending power.
Conversely, negative data may lead to declines in these stocks. During recessions, when GDP contracts and unemployment rises, cyclical sectors like travel and automotive often experience reduced demand, resulting in lower prices.
Risks and Rewards
Although when trading share CFDs, traders can take advantage of both rise and fall in the price of an asset, it’s important to be aware of the risks and rewards of cyclical stocks:
Risks
Economic Sensitivity: This stock type is vulnerable to economic conditions, leading to potentially greater risks due to the constantly changing environment.
Timing Challenges: Predicting the peaks and troughs of economic cycles is difficult. Misjudging the timing might lead to losses.
Volatility: They can experience sharp price fluctuations, adding to risks. Want to observe just how volatile these assets can be? Check them on FXOpen’s free TickTrader platform.
Rewards
High Growth Potential: During economic expansions, cyclical stocks may offer market-beating growth as consumer spending and corporate earnings increase.
Market Opportunities: Savvy investors and traders may take advantage of the predictable patterns of economic cycles.
Diversification: Including cyclical stocks in a portfolio can provide balance, as they often move opposite to defensive, counter-cyclical stocks.
Strategies for Trading Cyclical Stocks
In navigating the cyclical stock market, traders often employ several strategies:
Searching for Undervalued Stocks During Recessions: It's common to look for undervalued cyclical shares at the end of recessions. Such a period often presents opportunities for buying at lower prices, anticipating a rebound as the economy recovers.
Monitoring Economic Trends: Traders typically keep a close eye on indicators like interest rates and consumer spending. Recognising changing trends early may help in making informed decisions about when to buy or sell stocks.
Diversification: Traders often diversify their portfolios by including a mix of cyclical and non-cyclical shares. This strategy may help mitigate risk, providing protection against economic fluctuations.
Moving Into Defensive Stocks as the Economy Falters: As signs of downturn appear, traders may shift towards more defensive stocks, which are less affected by economic cycles.
The Bottom Line
These stocks, mirroring the economic cycle's highs and lows, offer unique opportunities but also pose specific challenges. By combining strategies such as monitoring economic trends, diversifying portfolios, and adopting a long-term view, traders may leverage the potential of cyclical stocks. For those seeking to delve deeper into this dynamic aspect of trading, opening an FXOpen account could be a valuable step towards engaging with the cyclical stock market. Happy trading!
This article represents the opinion of the Companies operating under the FXOpen brand only. It is not to be construed as an offer, solicitation, or recommendation with respect to products and services provided by the Companies operating under the FXOpen brand, nor is it to be considered financial advice.

Amazon Up side down tick chartupsidedown chart on amazon shows an HS with the right shoulder just retrced at 0.618 with extension on possible new all time hight

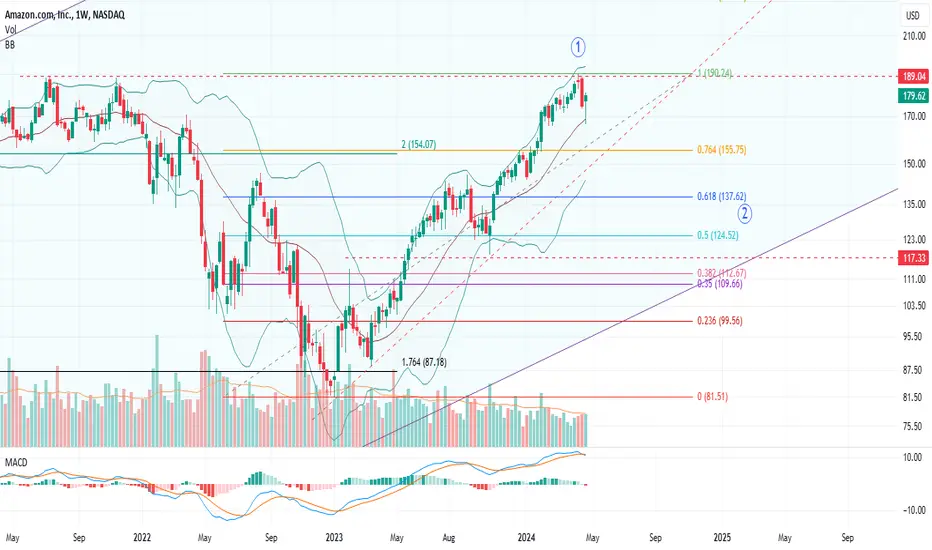
AMZN: Is wave 2 correction under way or another high first?Last week's candle seemed like the Amazon ride might be over for good. This week bulls attempt a heroic reversal. Test on weekly 20 EMA/ mid Bollinger band and getting support there is kind of a big deal. However, there is a MACD bearish cross on the weekly, along with resistance right on the mid Bollinger band on the daily time frame (not on this chart, but it is there). On lower time frame it looks like a 3 wave correction has completed last week, but it looks disproportionately small for being a primary degree correction. So my thesis for now is, either this is intermediate degree wave 4 correction and there will be one more high (and an all time high) incoming, or this is an A wave of some degree and it will be slow downward movement from here. For wave 2 correction, there are several support area targets. First on the market structure at 0.618 fib retrace at around $137 then somewhere between 0.5 and 0.38 fib retrace area $124- $112. On the upside, if we do see another high, the target would be somewhere between $214- $234 (other fib levels from various swings). Right now, waiting to see the current range ($190 - $165) to break before placing my bets...
AMAZON Under the 1D MA50 after 6 months. Is the bleeding over?Amazon (AMZN) has broken and closed below its 1D MA50 (blue trend-line) for the first time in 6 months (since October 27 2023). Last time this happened, the stock had already begun the 2nd Bearish Leg (-18.83% decline) of the 2-year Channel Up.
As a result, there's a real possibility for the stock to reach as low as the 0.382 Fiboancci retracement level and the 1D MA200 (orange trend-line) to form a new Higher Low near the bottom of the Channel Up and then rebound.
As long as the Channel Down of the Bearish Leg is intact and Amazon doesn't close a 1D candle above the 1D MA50, we will wait for a more comfortable buy at $160.00 and we will target $200.00 (+31.87% symmetrical rise as Dec 20 2023).
-------------------------------------------------------------------------------
** Please LIKE 👍, FOLLOW ✅, SHARE 🙌 and COMMENT ✍ if you enjoy this idea! Also share your ideas and charts in the comments section below! This is best way to keep it relevant, support us, keep the content here free and allow the idea to reach as many people as possible. **
-------------------------------------------------------------------------------
💸💸💸💸💸💸
👇 👇 👇 👇 👇 👇

Gaps unpredictable and frustrating to time it - AMZNIn Apr 22, had you waited 3 months for the gap to be filled up, your joy is short lived as it quickly plunge down more than 40% until Jan 23.
In Oct 22, the same thing happened. You went long and it quickly fell 20% until Jan 23. Very few people would have known the bottom was in Jan 2023, all these are on hindsight and then you go :"Had I known, I would have sold my house and went all in " kind of thing......
Then in May 23, look what happened. It gap up not a lot but till now, it has not been closed. So, the moral of the story is do not time the gap. It is unpredictable. Buy great businesses with solid fundamentals, strong economic moat and has proven itself years after years , like Amazon.
If for the small gap, you insisted to wait for it to fill up before going long, then you would have missed the potential 79% returns it offered you had you went long. REGRET? Then, you took revenge and bought more at the peak and it falls or crash like some of the tech stocks now and you lament about your bad luck. Such things happen every day, around the world to some people, hopefully it was all the past for us and we become wiser over time and not dabble in this prediction fantasy and ego boosting game of calling the market timing. Be in the market and let them do their job. That's all , investing is straight forward and boring but people come out with all kinds of stuff to make it complicated and confused themselves or out to make money for their own gains - thousands of indicators, thousands of online courses , videos, etc.
Wise up , guys !

where is the support zone?After a nice move up amazon came to the resistance line.
Where can we see support here?

Amazon looking bearish and forming a bear flag 🐻 🚩Amazon looking bearish and forming a bear flag 🐻 🚩
After its breakdown ⤵️, now with the bear flag 🚩formation shorting it is a high probability winning strategy 🧭
Mapped out our price targets and predicted price movement
👇

AMZNAmazon's earnings are coming out today after the bell. With consumer spending on the decline and key supports at $171, $165, and $161 potentially filling the February 24th gap, the stock faces crucial thresholds. A positive earnings report could propel the stock upward to around $185.

✅AMAZON BEARISH SETUP|SHORT🔥
✅AMAZON broke out of
The rising narrowing wedge
And the price is now going
Up in a rebound to retest
The broken levels above
But I am locally bearish
Biased and I will be
Expecting a further
Move down
SHORT🔥
✅Like and subscribe to never miss a new idea!✅

Amazon (Amzn) sold the $188 level. Here's what next...Hello Traders, Skyboxpips here!
Amazon stock did a sell off from the $188 level last week to the $173 price level closing out the previous weekly candle bearish.
Amazon is doing a retracement for the retest
It feels satisfying when predictions play out.

Amazon further correction pendingAmazon is continuing the uptrend within the channel. It is in correction mode and which is required to continue the uptrend.

Amazon Amazon was trading Bearish for the whole of 2022 into January this year and now we finally turned Bullish on May 15 with a Break in Structure at $113. Our main focus was the Propulsion Block resting at $126 and at the same level we had a Search and Destroy Profile sweeping 143.98 (High) and 126.33 (Low) Our first target is $159 and we looking to make a re entry around the same level. More updates to follow

$AMZN Bearish crab patternSo its not just NASDAQ:MSFT who's in bearish crab reversal zone but also NASDAQ:AMZN

amzn top is inI'm looking for the green levels to add, i really like the area in the mid 140s if it hits.

(NASDAQ:AMAZON) STOCK NEAR KEY IMPORTANT SUPPORT LEVELTHE CURRENT PRICE IS HOVERING ARROUND A CRUCIAL LEVEL
SHORT TERM PRICE TARGET $177.19 TO $171.81
Which will dictate its future direction based on market conditions.
For Amazon stock, reaching its all-time high for the third time prompts speculation: will there be a pullback, or will it establish strong support around $177.19 (Support #1), potentially indicating a 28% uptrend Breaking the recent record at $189.77 could signal a move towards $244.00, encountering a robust ascending resistance line.
Conversely, a downtrend is looming, with the price poised to confirm a potential 15% decline. Breaking below $177.19 might lead to filling the gap from February 1st and 2nd, ranging between $167.33 and $159.76. If this occurs, selling pressure could drive the price down to $144.60 (Support #2). Further analysis would be necessary to ascertain the price's trajectory.
Should these scenarios unfold, it's essential to consider the historical context: Amazon experienced significant declines in August 2018 (pre-COVID) and November 2021, averaging around -46.64%, possibly returning to pre-pandemic levels.
Here are the key levels to monitor closely, as breaching any of them could signal significant market movements.
1.-Near Key Level: Amazon's stock is currently approaching a critical level, which could determine its future trajectory depending on prevailing market conditions. This indicates a crucial juncture where investors may reassess their positions based on various factors impacting the market.
2.- Third Time All-Time High: Amazon reaching its all-time high for the third time raises questions about the sustainability of its upward momentum. This could either signal a continuation of the bullish trend or potentially trigger a pullback as investors consider profit-taking and market sentiment.
3.- Support Levels: There is mention of a strong support level at $177.19 (Support #1), which could potentially lead to a significant uptrend of around 28%. However, breaking below this support level may increase the likelihood of a downward movement, possibly towards $144.60 (Support #2).
4.-Resistance Levels: Breaking recent resistance levels, particularly at $189.77, could pave the way for further upside potential, with a target price of $244.00. However, reaching strong ascending resistance lines at these levels suggests potential challenges for further price appreciation.
5.-Downtrend Potential: There's a looming possibility of a 15% drop in Amazon's stock price, particularly if it breaks below the $177.19 support level. This could lead to filling a previous price gap and potentially trigger selling pressure, pushing the stock towards Support #2 at $144.60.
6.- Historical Performance: Consideration of Amazon's historical performance, including significant declines in August 2018 and November 2021, averaging around -46.64%, provides additional context for assessing potential future movements. This historical data suggests that Amazon's stock may be prone to significant fluctuations under certain market conditions.
7.- Additionally, it's worth noting the upcoming earnings for Amazon stock, with an estimated EPS (Earnings Per Share) of $0.83. This impending earnings release could significantly impact investor sentiment and contribute to short-term price movements in the stock.
8.-When the price reaches its all-time high for the third time, according to technical analysis (TA), it often signifies a significant level of resistance. This repeated failure to surpass the previous high may suggest a potential barrier to further upward movement in the short term. Traders and analysts may interpret this as a signal to exercise caution and anticipate a possible reversal or consolidation in the price action.
Overall, the future performance of Amazon's stock appears to be influenced by a combination of technical factors, market sentiment, and historical patterns. Investors should closely monitor key support and resistance levels, as well as broader market trends, to make informed decisions regarding their Amazon holdings.
NFA
PLEASE, DYOR/MYOD!!
Hope to See your Likes 👍 to Support My Work
To Follow All My Ideas, Go to My Profile and Select the Follow Green button 😁
Please Re-Evaluate Before Make Your Last Decisions
Check my Profile for more.

Amazon channel is turning bearish to $134.51 watch outAmazon has had an incredible run. It's moved from $118 to $188 since November 2023.
But now it looks like the momentum is starting to slow down.
We haven't got a confirmed signal but we see a slow down in buying and the market is at the bottom of the channel.
There is still a gap to close and for the this reason, I'm anticipating a fall in Amazon in the next few weeks. THe first target will be at $134.51 and will be a medium term analysis.

Amazon DailyShorter term rallies ending left and right, across a wide range of instruments and sectors.
Liquidity vacuum.

AMZN has topped - Apr 18 2024AMZN got a perfect weekly topping candle, followed by a bearish engulfing candle (one more day to confirm)
Watch for a dip below the 150 level.
Im going to short it very soon, will post it live when I do

(NASDAQ;AMZN) AMAZON STOCK NEAR KEY IMPORTANT LEVELThe current price is hovering around a crucial level, which will dictate its future direction based on market conditions.
For Amazon stock, reaching its all-time high for the third time prompts speculation: will there be a pullback, or will it establish strong support around $177.19 (Support #1), potentially indicating a 28% uptrend Breaking the recent record at $189.77 could signal a move towards $244.00, encountering a robust ascending resistance line.
Conversely, a downtrend is looming, with the price poised to confirm a potential 15% decline. Breaking below $177.19 might lead to filling the gap from February 1st and 2nd, ranging between $167.33 and $159.76. If this occurs, selling pressure could drive the price down to $144.60 (Support #2). Further analysis would be necessary to ascertain the price's trajectory.
Should these scenarios unfold, it's essential to consider the historical context: Amazon experienced significant declines in August 2018 (pre-COVID) and November 2021, averaging around -46.64%, possibly returning to pre-pandemic levels.
Here are the key levels to monitor closely, as breaching any of them could signal significant market movements.
1.-Near Key Level: Amazon's stock is currently approaching a critical level, which could determine its future trajectory depending on prevailing market conditions. This indicates a crucial juncture where investors may reassess their positions based on various factors impacting the market.
2.- Third Time All-Time High: Amazon reaching its all-time high for the third time raises questions about the sustainability of its upward momentum. This could either signal a continuation of the bullish trend or potentially trigger a pullback as investors consider profit-taking and market sentiment.
3.- Support Levels: There is mention of a strong support level at $177.19 (Support #1), which could potentially lead to a significant uptrend of around 28%. However, breaking below this support level may increase the likelihood of a downward movement, possibly towards $144.60 (Support #2).
4.-Resistance Levels: Breaking recent resistance levels, particularly at $189.77, could pave the way for further upside potential, with a target price of $244.00. However, reaching strong ascending resistance lines at these levels suggests potential challenges for further price appreciation.
5.-Downtrend Potential: There's a looming possibility of a 15% drop in Amazon's stock price, particularly if it breaks below the $177.19 support level. This could lead to filling a previous price gap and potentially trigger selling pressure, pushing the stock towards Support #2 at $144.60.
6.- Historical Performance: Consideration of Amazon's historical performance, including significant declines in August 2018 and November 2021, averaging around -46.64%, provides additional context for assessing potential future movements. This historical data suggests that Amazon's stock may be prone to significant fluctuations under certain market conditions.
7.- Additionally, it's worth noting the upcoming earnings for Amazon stock, with an estimated EPS (Earnings Per Share) of $0.83. This impending earnings release could significantly impact investor sentiment and contribute to short-term price movements in the stock.
8.-When the price reaches its all-time high for the third time, according to technical analysis (TA), it often signifies a significant level of resistance. This repeated failure to surpass the previous high may suggest a potential barrier to further upward movement in the short term. Traders and analysts may interpret this as a signal to exercise caution and anticipate a possible reversal or consolidation in the price action.
Overall, the future performance of Amazon's stock appears to be influenced by a combination of technical factors, market sentiment, and historical patterns. Investors should closely monitor key support and resistance levels, as well as broader market trends, to make informed decisions regarding their Amazon holdings.
NFA
PLEASE, DYOR/MYOD!!
Hope to See your Likes 👍 to Support My Work
To Follow All My Ideas, Go to My Profile and Select the Follow Green button 😁
Please Re-Evaluate Before Make Your Last Decisions
Check my Profile for more.

Amazon AnalysisAmazon has taken liquidity to the upside, we at Capital Wisdom see a necessary pullback to lower levels.
In our indicators NASDAQ:AMZN is HOLD , we have a big liquidity at $161.21, we have big selling pressure from the insiders, more than $ 8B in selling.
Overall
Company has healthy profit margins, considering the average of the sector
Company has healthy debt considering revenue and cash at disposal
If we get a big market correction because of interest rates we could visit $ 120 levels.
We see that as the most probable scenario.
But if the markets continues to the upside, we see as a possible target the range of $230.
If you want more information you can check our website for free.

Short Selling Opportunity In AmazonNASDAQ:AMZN
Entry - 185.07/-
Target 1 - 182.78/-
Target 2 - 180.64/-
MACD also indicates a bearish trend.

75: Will Amazon Climb Higher After Bezos' Selling?In a recent move, Jeff Bezos, the CEO of Amazon, has sold $2 billion worth of Amazon stock, raising questions about the company's future trajectory. Bezos sold 12 million shares this week, marking his first sale since 2021. Additionally, Amazon revealed that Bezos plans to sell up to 50 million shares over the next 12 months.
This significant sale by Bezos, coupled with his plans for future divestment, raises speculation about Amazon's stock performance. Despite the sale, Amazon's stock has been on an upward trend, closing at its highest level in over two years.
Investors are left wondering whether Bezos' selling spree will impact Amazon's stock positively or negatively. With Amazon's stock closing at $174, the potential sale of 50 million shares could lead to Bezos reclaiming his title as the world's richest person.
Given Bezos' history of selling shares and the ongoing bullish trend in big tech stocks, there's uncertainty about Amazon's future direction. Traders will closely monitor Amazon's stock performance in the coming months to assess whether it will continue climbing higher or face downward pressure following Bezos' divestment.
