My final idea on NokiaToday there is an article on TradingView in regards to Nokia and AT&T.
AT&T has apparently chosen Ericsson to "modernize its U.S. telecoms network" instead of Nokia for a $14,000,000,000 contract.
www.tradingview.com
Nokia share prices have plummeted almost 16% in the past 3 trading days, today bei
Next report date
—
Report period
—
EPS estimate
—
Revenue estimate
—
0.1480EUR
665.00 MEUR
22.26 BEUR
5.10 B
About NOKIA CORPORATION
Sector
Industry
CEO
Pekka Ilmari Lundmark
Website
Headquarters
Espoo
Founded
1865
ISIN
FI0009000681
FIGI
BBG00HVY2F07
Nokia Oyj engages in the provision of network infrastructure, technology, and software services. It operates through the following segments: Mobile Networks, Network Infrastructure, Cloud and Network Services, and Nokia Technologies. The Mobile Networks segment offers technologies for Radio Access Networks (RAN) as well as Microwave Radio Links (MWR) for transport networks. The Network Infrastructure serves communication service providers, enterprises, webscales and public sector customers. The Cloud and Network Services segment builds around software and the cloud and is focused on driving leadership in cloud-native software and as-a-service delivery models, as demand for critical networks accelerates; and with strong market positions in communications software, private wireless networks, and cognitive (or intelligent) services. The Nokia Technologies segment, building on decades of innovation and R&D leadership in technologies used in virtually all mobile devices used today, is expanding the Nokia patent licensing business, reintroducing the Nokia brand to smartphones through brand licensing, and establishing a technology licensing business. The company was founded by Fredrik Idestam in 1865 and is headquartered in Espoo, Finland.

NOKIA - Long-Term"Long" Term does not imply "going Long" mind you .. just means .. eh .. like much time ..
Made a nice "Fib", they seem to be important to 'Traders' and 'Anal-ysts®' (not to me, sorry),
I just draw that humbug in here because all my other IDEA's usually have pretty empty charts (see some lines fur

Nokia (NOK) possible recoveryNokia completed the share buyback, which started in February 2022, in November 2023. On the monthly chart, there is divergence in the MFI, KDJ is looking to cross upwards. Apparently 2024 will be a key year for the company. The fair price at the moment seems to be around the VPVR, around $5

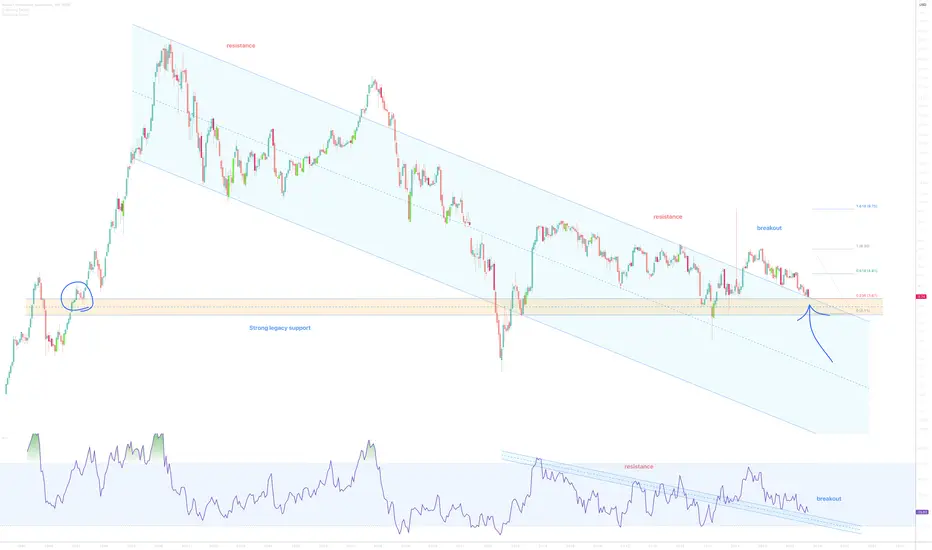
NOKIA: Daily Chart UpdateNews are shaking the price so good luck trying to guess the direction. Based on the trend lines I'd still expect upside coming in the next few weeks if we keep diving lower.

NOKIA: Intraday UpdateAfter testing the strong daily key level multiple times the price is heading lower towards next support zones.

NOKIA: Areas to look out for on a 4h chartCurrently in a downtrend, things might take a turn as we're going towards strong key levels.

Nokia catch this wave up!!I guess we cant go lower and we are about to break out upwards. Lest see how it will go.

NOK, SELL, 7.08% PROFITShort selling NYSE:NOK on 10/18/2023 near market close and closed position on 10/19/2023 at market open. Net 7.08% profit.

Nokia and Cybernet deploy Pakistan’s first 6G commercial networkKarachi, Pakistan – Nokia and Cybernet, the leading fixed-line telecommunications provider in Pakistan, today announced they have deployed the country’s first DWDM network operating at 600Gbps per wavelength. The DWDM network enables Cybernet to deliver a high capacity, robust network that is capabl

Is NOKIA about to wake from its deep deep sleep?Perhaps.
** investment opportunity **
23 years ago traders were exchanging Nokia stock at $60 a share. No splits since that time and now yours for under $4. Dividend yield @ 1.98%.
On the above 3-week chart price action has corrected over 90%. A number of reasons now exist for a bullish outlook.
See all ideas
Trade directly on the supercharts through our supported, fully-verified and user-reviewed brokers.


Curated watchlists where NOKI is featured.


Frequently Asked Questions
The current price of NOKI is 3.4930 EUR — it has increased by 0.56% in the past 24 hours. Watch NOKIA OYJ stock price performance more closely on the chart.
Depending on the exchange, the stock ticker may vary. For instance, on VIE exchange NOKIA OYJ stocks are traded under the ticker NOKI.
NOKIA OYJ is going to release the next earnings report on Jul 18, 2024. Keep track of upcoming events with our Earnings Calendar.
NOKI stock is 0.56% volatile and has beta coefficient of 1.06. Track NOKIA OYJ stock price on the chart and check out the list of the most volatile stocks — is NOKIA OYJ there?
NOKI earnings for the last quarter are 0.09 EUR per share, whereas the estimation was 0.07 EUR resulting in a 24.61% surprise. The estimated earnings for the next quarter are 0.05 EUR per share. See more details about NOKIA OYJ earnings.
NOKIA OYJ revenue for the last quarter amounts to 4.67 B EUR despite the estimated figure of 4.97 B EUR. In the next quarter revenue is expected to reach 4.92 B EUR.
Yes, you can track NOKIA OYJ financials in yearly and quarterly reports right on TradingView.
NOKI stock has risen by 1.76% compared to the previous week, the month change is a 8.44% rise, over the last year NOKIA OYJ has showed a 7.59% decrease.
NOKI net income for the last quarter is 435.00 M EUR, while the quarter before that showed −44.00 M EUR of net income which accounts for 1.09 K% change. Track more NOKIA OYJ financial stats to get the full picture.
Today NOKIA OYJ has the market capitalization of 19.12 B, it has decreased by 0.74% over the last week.
Yes, NOKI dividends are paid quarterly. The last dividend per share was 0.04 EUR. As of today, Dividend Yield (TTM)% is 3.76%. Tracking NOKIA OYJ dividends might help you take more informed decisions.
Like other stocks, NOKI shares are traded on stock exchanges, e.g. Nasdaq, Nyse, Euronext, and the easiest way to buy them is through an online stock broker. To do this, you need to open an account and follow a broker's procedures, then start trading. You can trade NOKIA OYJ stock right from TradingView charts — choose your broker and connect to your account.
NOKI reached its all-time high on Jan 28, 2019 with the price of 5.7360 EUR, and its all-time low was 2.1400 EUR and was reached on Mar 17, 2020. View more price dynamics on NOKI chart.
See other stocks reaching their highest and lowest prices.
See other stocks reaching their highest and lowest prices.
Investing in stocks requires a comprehensive research: you should carefully study all the available data, e.g. company's financials, related news, and its technical analysis. So NOKIA OYJ technincal analysis shows the strong buy rating today, and its 1 week rating is buy. Since market conditions are prone to changes, it's worth looking a bit further into the future — according to the 1 month rating NOKIA OYJ stock shows the sell signal. See more of NOKIA OYJ technicals for a more comprehensive analysis.
If you're still not sure, try looking for inspiration in our curated watchlists.
If you're still not sure, try looking for inspiration in our curated watchlists.
We've gathered analysts' opinions on NOKIA OYJ future price: according to them, NOKI price has a max estimate of 6.50 EUR and a min estimate of 2.90 EUR. Watch NOKI chart and read a more detailed NOKIA OYJ stock forecast: see what analysts think of NOKIA OYJ and suggest that you do with its stocks.
EBITDA measures a company's operating performance, its growth signifies an improvement in the efficiency of a company. NOKIA OYJ EBITDA is 3.23 B EUR, and current EBITDA margin is 14.50%. See more stats in NOKIA OYJ financial statements.