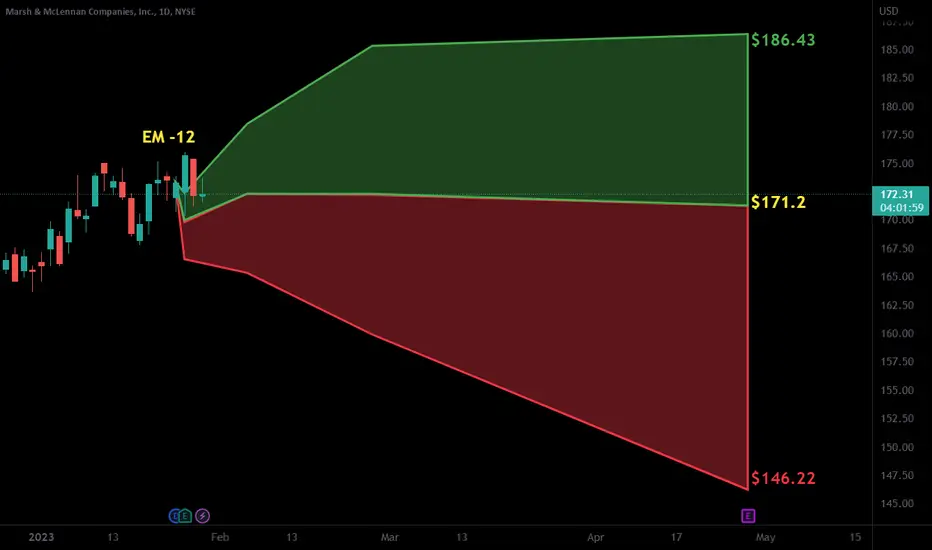
UpdatE: MMC, bought, Take Profit +8.12%, STOP Loss -1.59% NYSE:MMC
UpdatE: MMC, bought, Take Profit +8.12%, STOP Loss -1.59%
Next report date
—
Report period
—
EPS estimate
—
Revenue estimate
—
7.35EUR
3.40 BEUR
20.62 BEUR
492.25 M
About Marsh & McLennan Companies, Inc.
Sector
Industry
CEO
John Q. Doyle
Website
Headquarters
New York
Employees (FY)
85 K
Founded
1871
FIGI
BBG00QPL5HB3
Marsh & McLennan Cos., Inc. is a professional services firm, which engages in offering clients advice and solutions in risk, strategy, and people. It operates through the Risk and Insurance Services, and Consulting segments. The Risk and Insurance Services segment is involved in risk management activities, as well as insurance and reinsurance broking and services. The Consulting segment offers health, wealth, and career solutions and products, and specialized management, strategic, economic, and brand consulting services. The company was founded by Henry W. Marsh and Donald R. McLennan in 1871 and is headquartered in New York, NY.


$MMC with a bullish outlook following its earnings #StocksThe PEAD projected a bullish outlook for NYSE:MMC after a negative over reaction following its earnings release placing the stock in drift C with an expected accuracy of 60%.

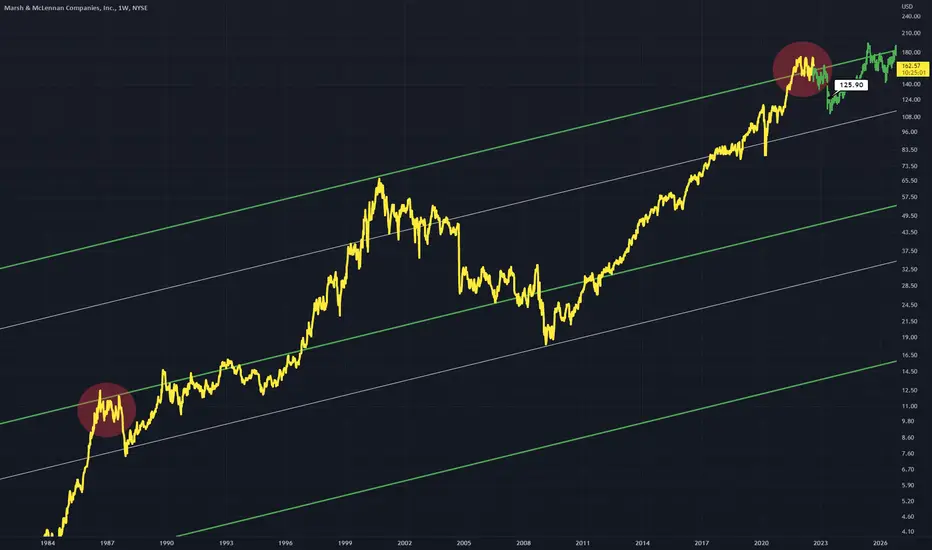
Marsh & McLennan Companies (MMC) Weekly Chart AnalysisCompany: Marsh & McLennan Companies
Ticker: MMC
Exchange: NYSE
Sector: Financial Services
Introduction:
Hello and thank you for taking the time to read my post. Today, we analyze the Marsh & McLennan Companies (MMC) chart on the weekly scale, focusing on a classic price pattern called the "Rect

$MMC with a bullish outlook following its earnings #StocksThe PEAD projected a bullish outlook for NYSE:MMC after a positive under reaction following its earnings release placing the stock in drift A with an expected accuracy of 63.64%.

Bouncing up on Marsh&McLennan. MMCWithin a channel, looking like ABCDE according to Elliot. Volume flow toward longs, and I bet P/C Ratio is bullish also.
I never shared an idea on this one for a while, but you can see a Gartley painted in there and the result.
We are not in the business of getting every prediction right, no one

$MMC with a Bearish outlook following its earnings #Stocks The PEAD projected a Bearish outlook for $MMC after a Negative under reaction following its earnings release placing the stock in drift D with an expected accuracy of 66.67%.
$MMC with a Bullish outlook following its earnings #Stocks The PEAD projected a Bullish outlook for $MMC after a Positive over reaction following its earnings release placing the stock in drift B with an expected accuracy of 50%.

MMC PRICE FORECASTLately ive been picking from Warren Buffets Portfolio and finding stocks in
the same industry to outperform
I will re invest when im Guaranteed the markets recovered
Sector: Financial
Industry: insurance brokers
RECOVERY YIELDS FROM JUNE
MMC 20.02%
AJG 27.62%
BRO 26.15%
BRP 41.74%
CRVL 26.10%

MMC - Similar Trend Line Test InstancesMMC Is testing a parallel resistance zone This can be compared to a previous point in price evolution history where this occurred also Both situations will result in a short rejection
See all ideas
Trade directly on the supercharts through our supported, fully-verified and user-reviewed brokers.


Curated watchlists where MMCO is featured.

Frequently Asked Questions
The current price of MMCO is 189.95 EUR — it has increased by 1.25% in the past 24 hours. Watch MARSH & MCLENNAN CO INC stock price performance more closely on the chart.
Depending on the exchange, the stock ticker may vary. For instance, on VIE exchange MARSH & MCLENNAN CO INC stocks are traded under the ticker MMCO.
MARSH & MCLENNAN CO INC is going to release the next earnings report on Jul 18, 2024. Keep track of upcoming events with our Earnings Calendar.
MMCO stock is 1.24% volatile and has beta coefficient of 0.32. Track MARSH & MCLENNAN CO INC stock price on the chart and check out the list of the most volatile stocks — is MARSH & MCLENNAN CO INC there?
MMCO earnings for the last quarter are 2.68 EUR per share, whereas the estimation was 2.60 EUR resulting in a 3.16% surprise. The estimated earnings for the next quarter are 2.23 EUR per share. See more details about MARSH & MCLENNAN CO INC earnings.
MARSH & MCLENNAN CO INC revenue for the last quarter amounts to 6.00 B EUR despite the estimated figure of 5.92 B EUR. In the next quarter revenue is expected to reach 5.87 B EUR.
Yes, you can track MARSH & MCLENNAN CO INC financials in yearly and quarterly reports right on TradingView.
MMCO stock has risen by 2.37% compared to the previous week, the month change is a 0.24% rise, over the last year MARSH & MCLENNAN CO INC has showed a 15.12% increase.
MMCO net income for the last quarter is 1.30 B EUR, while the quarter before that showed 684.94 M EUR of net income which accounts for 89.43% change. Track more MARSH & MCLENNAN CO INC financial stats to get the full picture.
Today MARSH & MCLENNAN CO INC has the market capitalization of 93.32 B, it has increased by 0.02% over the last week.
Yes, MMCO dividends are paid quarterly. The last dividend per share was 0.66 EUR. As of today, Dividend Yield (TTM)% is 1.39%. Tracking MARSH & MCLENNAN CO INC dividends might help you take more informed decisions.
MARSH & MCLENNAN CO INC dividend yield was 1.44% in 2023, and payout ratio reached 36.14%. The year before the numbers were 1.39% and 38.16% correspondingly. See high-dividend stocks and find more opportunities for your portfolio.
Like other stocks, MMCO shares are traded on stock exchanges, e.g. Nasdaq, Nyse, Euronext, and the easiest way to buy them is through an online stock broker. To do this, you need to open an account and follow a broker's procedures, then start trading. You can trade MARSH & MCLENNAN CO INC stock right from TradingView charts — choose your broker and connect to your account.
MMCO reached its all-time high on Mar 18, 2024 with the price of 191.05 EUR, and its all-time low was 71.50 EUR and was reached on Mar 23, 2020. View more price dynamics on MMCO chart.
See other stocks reaching their highest and lowest prices.
See other stocks reaching their highest and lowest prices.
As of May 9, 2024, the company has 85.00 K employees. See our rating of the largest employees — is MARSH & MCLENNAN CO INC on this list?
Investing in stocks requires a comprehensive research: you should carefully study all the available data, e.g. company's financials, related news, and its technical analysis. So MARSH & MCLENNAN CO INC technincal analysis shows the strong buy rating today, and its 1 week rating is strong buy. Since market conditions are prone to changes, it's worth looking a bit further into the future — according to the 1 month rating MARSH & MCLENNAN CO INC stock shows the buy signal. See more of MARSH & MCLENNAN CO INC technicals for a more comprehensive analysis.
If you're still not sure, try looking for inspiration in our curated watchlists.
If you're still not sure, try looking for inspiration in our curated watchlists.
We've gathered analysts' opinions on MARSH & MCLENNAN CO INC future price: according to them, MMCO price has a max estimate of 222.59 EUR and a min estimate of 182.38 EUR. Watch MMCO chart and read a more detailed MARSH & MCLENNAN CO INC stock forecast: see what analysts think of MARSH & MCLENNAN CO INC and suggest that you do with its stocks.
EBITDA measures a company's operating performance, its growth signifies an improvement in the efficiency of a company. MARSH & MCLENNAN CO INC EBITDA is 6.30 B EUR, and current EBITDA margin is 29.33%. See more stats in MARSH & MCLENNAN CO INC financial statements.