YEARLY SHOOTING STAR - CLEAR SKYS Semi Conductors are the news... why not the chemical's?
The Chemours Company (CC) is a global leader in the production of specialty chemicals, serving a wide range of industries including automotive, electronics, and construction.
ATH $58
Hard Off with loads of Hungry bulls
Currently in the gold
Next report date
—
Report period
—
EPS estimate
—
Revenue estimate
—
−2.05EUR
−215.63 MEUR
5.46 BEUR
147.11 M
About Chemours Company (The)
Sector
CEO
Denise M. Dignam
Headquarters
Wilmington
Website
Employees (FY)
6.2 K
Founded
2014
FIGI
BBG01LKWZ2Y9
The Chemours Co. is a holding company, which engages in the provision of performance chemicals. The firm delivers solutions, which include a range of industrial and chemical products for markets including coatings, plastics, refrigeration and air conditioning, transportation, semiconductor and consumer electronics, and general industrial. It operates through the following segments: Titanium Technologies, Thermal and Specialized Solutions, Advanced Performance Materials, and Other. The Titanium Technologies segment is involved in the manufacture of titanium dioxide pigment. The Thermal and Specialized Solutions segment offers refrigerants, propellants, blowing agents, and specialty solvents. The Advanced Performance Materials segment produces polymers and advanced materials that deliver attributes, including chemical inertness, thermal stability, low friction, weather and corrosion resistance, extreme temperature stability, and di-electric properties. The Other segment consists of performance chemicals and intermediates business. The company was founded on February 18, 2014, and is headquartered in Wilmington, DE.

CHEMOURS Stock Chart Fibonacci Analysis 052123Trading Idea
1) Find a FIBO slingshot
2) Check FIBO 61.80% level
3) Entry Point > 28.5/61.80%

CC - Green or Red ? An idea showing two directions up in green, down in red.
My bearish side tells me that price is "rolling over" and turning towards the bearish side (red)
Bulls want to continue the trend of creating higher lows

sell CCstrong red bar from the volume ind means a strong presence of sellers that will push the market down

$CC / LongScan Criteria
Does this stock meet my custom 12 point scan criteria? Yes, came through on my 40/40 Earnings Scans
Structural Checklist
1. Can a proven price patterns be identified? Yes, Cheat
2. Is the 50D SMA trending up? Yes
3. Has price moved >20% since its last consolidation? Yes
4.

$CC 7 Months Base$CC 7 months base that is now building a cheat area after breaking its downtrend (red dotted line).
One to add to your WL and see how it develops.
RS @ 78 not the strongest but this is constructive action so far.

CC sitting on support. Back to 29.50We are right on a support at 27.50 with this ticker. 6 straight red days yet I can't find any negative news. RSI looking oversold. Look at those volume candles the past 5 days! Eventually the sellers are all dried up and all that is left is buyers like me.
Profitable company with 70%+ institutional

The Chemours Company Reports Strong First Quarter Results and InCC: The Chemours Company
2021-05-03 16:00:00
The Chemours Company Reports Strong First Quarter Results and Increases Full-Year 2021 Outlook
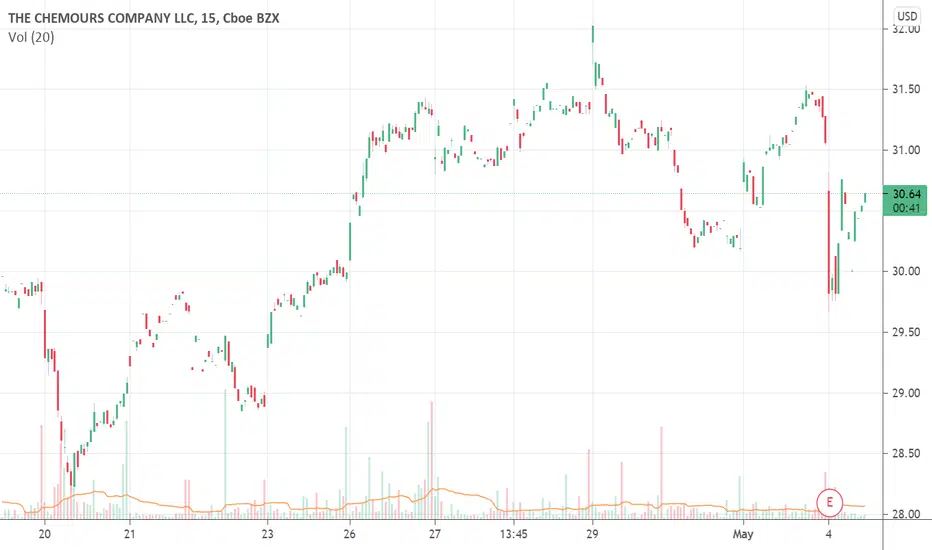

THE CHEMOURS COMPANY ChartHello traders, THE CHEMOURS COMPANY is in a fake bearish trend with a sell volume return issued and a kind of hammer candle. Looking at the TIMEFRAME M1 we see a marubozu with higher purchase volume than sales it starts on the last previous sound lower. And make a reversal it goes on the VWAP to bre

See all ideas
Trade directly on the supercharts through our supported, fully-verified and user-reviewed brokers.


Frequently Asked Questions
The current price of CHEM is 25.71 EUR — it has increased by 1.74% in the past 24 hours. Watch CHEMOURS CO/THE stock price performance more closely on the chart.
Depending on the exchange, the stock ticker may vary. For instance, on VIE exchange CHEMOURS CO/THE stocks are traded under the ticker CHEM.
CHEMOURS CO/THE is going to release the next earnings report on Jul 25, 2024. Keep track of upcoming events with our Earnings Calendar.
CHEM stock is 1.71% volatile and has beta coefficient of 1.62. Track CHEMOURS CO/THE stock price on the chart and check out the list of the most volatile stocks — is CHEMOURS CO/THE there?
CHEM earnings for the last quarter are 0.30 EUR per share, whereas the estimation was 0.17 EUR resulting in a 76.63% surprise. The estimated earnings for the next quarter are 0.60 EUR per share. See more details about CHEMOURS CO/THE earnings.
CHEMOURS CO/THE revenue for the last quarter amounts to 1.25 B EUR despite the estimated figure of 1.25 B EUR. In the next quarter revenue is expected to reach 1.42 B EUR.
Yes, you can track CHEMOURS CO/THE financials in yearly and quarterly reports right on TradingView.
CHEM stock has risen by 1.50% compared to the previous week, the month change is a 3.21% rise, over the last year CHEMOURS CO/THE has showed a 4.73% increase.
CHEM net income for the last quarter is 48.19 M EUR, while the quarter before that showed −23.56 M EUR of net income which accounts for 304.59% change. Track more CHEMOURS CO/THE financial stats to get the full picture.
Today CHEMOURS CO/THE has the market capitalization of 3.81 B, it has decreased by 4.34% over the last week.
Yes, CHEM dividends are paid quarterly. The last dividend per share was 0.23 EUR. As of today, Dividend Yield (TTM)% is 3.64%. Tracking CHEMOURS CO/THE dividends might help you take more informed decisions.
Like other stocks, CHEM shares are traded on stock exchanges, e.g. Nasdaq, Nyse, Euronext, and the easiest way to buy them is through an online stock broker. To do this, you need to open an account and follow a broker's procedures, then start trading. You can trade CHEMOURS CO/THE stock right from TradingView charts — choose your broker and connect to your account.
CHEM reached its all-time high on Jan 24, 2024 with the price of 29.65 EUR, and its all-time low was 17.12 EUR and was reached on Feb 29, 2024. View more price dynamics on CHEM chart.
See other stocks reaching their highest and lowest prices.
See other stocks reaching their highest and lowest prices.
As of May 9, 2024, the company has 6.20 K employees. See our rating of the largest employees — is CHEMOURS CO/THE on this list?
We've gathered analysts' opinions on CHEMOURS CO/THE future price: according to them, CHEM price has a max estimate of 35.29 EUR and a min estimate of 23.21 EUR. Watch CHEM chart and read a more detailed CHEMOURS CO/THE stock forecast: see what analysts think of CHEMOURS CO/THE and suggest that you do with its stocks.
EBITDA measures a company's operating performance, its growth signifies an improvement in the efficiency of a company. CHEMOURS CO/THE EBITDA is 94.53 M EUR, and current EBITDA margin is 3.65%. See more stats in CHEMOURS CO/THE financial statements.