bear flag in making?Looks like TD in making a daily bear flag....I would try some TD for a short term bounce around 62.20/30 if 61.75 holds.
TD.PF.E trade ideas

TD Rising Wedge SetupAs TD continues if it bounces off the green line I will assume a short play if it continues passed the green line I will go long.
I am bear biased on the market. Its more likely that it will continue higher 55% and 45% it will go lower. Stocks usually go up :P
This is a journal entry. Not trading advice.


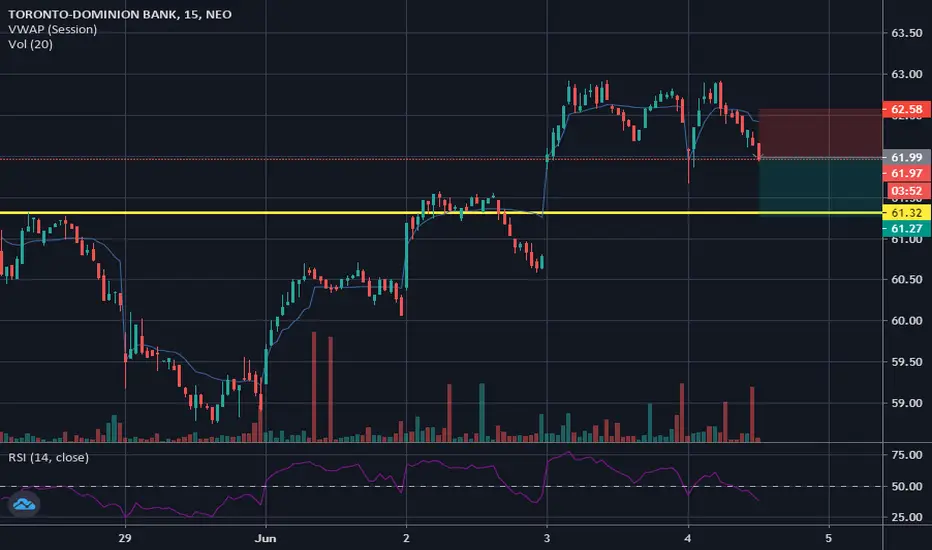
Short in short term to fill the gapLooks like money rotating to Banks which is great, however, there are 2 gaps that need to be fill. I will be short here with gap fill targets.
The risk to reward is around 1:4


catch the daily HL on TD?AS it showed if we can bounce from here to set the HL daily risk to reward trade is approx 1:3.


TD BuyTD stock is still correcting and should take time to return to pre corona levels, I am anticipating a price movement to $70 CAD by the beginning of 2021


TD Bank going long Seems like TD bank has bottomed out. Canadian banking sector is strong. I am going long on TD.


Can TD find solution to TD OIL security ? find the answer The second down trend wave is DUE and HERE. MA 200 and MA 25 showed gap bearish on Feb 25th 14th of April and 20th of April. Those are very significant gaps as they happened between MA 25 and MA 200.
RSI showed resistance for Jan-April Support line as well as March-April lines.
It is very hard to predict where to close your short position. but 48.55$ is a collection area
PLEASE SUPPORT ME BY A LIKE SO I CAN DO MORE ANALYSIS.
IF YOU NEED TO ANALYZE A STOCK LET ME KNOW


VOLATILITY: Using RSI, AO, KST and TSX IndexHey there, first idea, trying to get reputation for chat so I can learn more.
I'm using RSI to get an idea of when a stock is over/under sold as an indicator for a reversal.
I'm using AO to get an idea of short-term vs long term trends as an indicator for a reversal trend.
I'm using KST for the same reasons.
I compare these against the current trend of the stock and the TSX Index.
I see our current situation as a channel of volatile uncertainty in a general upward trend that will continue until full economic revoery and we'll end-up with an L shape.


TD drop below moving averageback to top of 2008 level and gonna see a consolidation level around this range. If it gets supported over the next few weeks, it will become bullish

