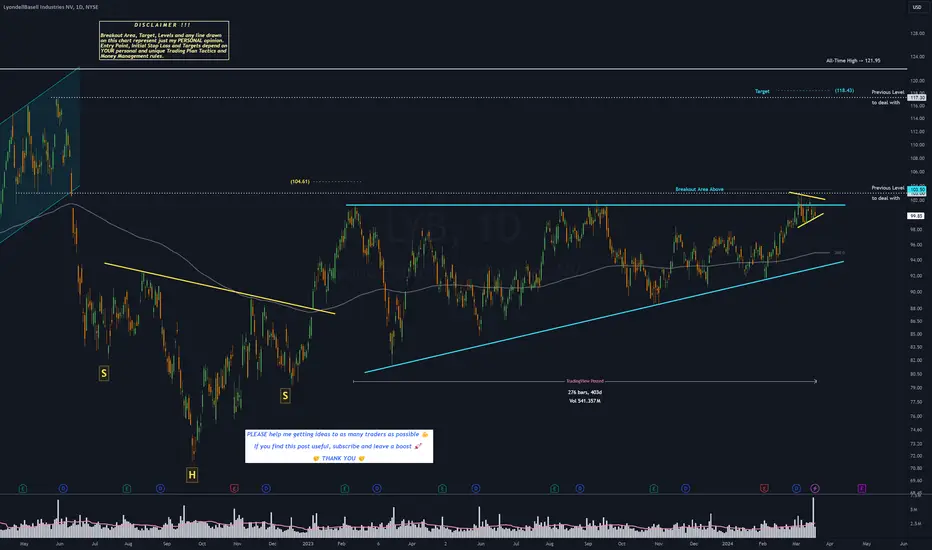
LYB - 13 months ASCENDING TRIANGLE══════════════════════════════
Since 2014, my markets approach is to spot
trading opportunities based solely on the
development of
CLASSICAL CHART PATTERNS
🤝Let’s learn and grow together 🤝
══════════════════════════════
Hello Traders ✌
After a careful consideration I came to the conclusion that:
-
Next report date
Report period
Q2 2024
EPS estimate
2.09EUR
Revenue estimate
9.63 BEUR
5.88EUR
1.92 BEUR
37.07 BEUR
258.94 M
About LyondellBasell Industries NV
Sector
CEO
Peter Vanacker
Headquarters
London
Website
Employees (FY)
20 K
Founded
2013
ISIN
NL0009434992
FIGI
BBG0017X0BQ4
LyondellBasell Industries NV engages in the refinery and production of plastic resins and other chemicals. It operates through the following segments: Olefins and Polyolefins-Americas; Olefins and Polyolefins-Europe, Asia, International; Intermediates and Derivatives; Advanced Polymer Solutions; Refining; and Technology. The Olefins and Polyolefins-Americas segment produces and markets olefins and co-products, polyethylene and polypropylene. The Olefins and Polyolefins-Europe, Asia, International segment also offers olefins and polyolefins. The Intermediates and Derivatives segment includes propylene oxide and its derivatives; oxyfuels and related products; and intermediate chemicals. The Advanced Polymer Solutions segment produces and markets compounding and solutions, such as polypropylene compounds, engineered plastics, masterbatches, colors and powders, engineered composites, and advanced polymers. The Refining segment refines heavy, high-sulfur crude oil and other crude oils of varied types and sources. The Technology segment develops chemical and polyolefin process technologies and manufactures and sells polyolefin catalysts. The company was founded in December 2007 and is headquartered in London, the United Kingdom.
LYB - Waiting Pullback to Join the TrendNYSE:LYB is in a good momentum for the upside.
This trade is an opportunity to join the trend and take a quick profit.
1st target: 2:1
2nd target 5:1
This is a one time try trade. Price hit stop loss, I won't try it again, even if price goes back up.

$LYB with a bullish outlook following its earnings #StocksThe PEAD projected a bullish outlook for $LYB after a positive under reaction following its earnings release placing the stock in drift A with an expected accuracy of 80%.

$LYB with a Bullish outlook following its earnings #Stocks The PEAD projected a Bullish outlook for $LYB after a Positive over reaction following its earnings release placing the stock in drift B with an expected accuracy of 100%.

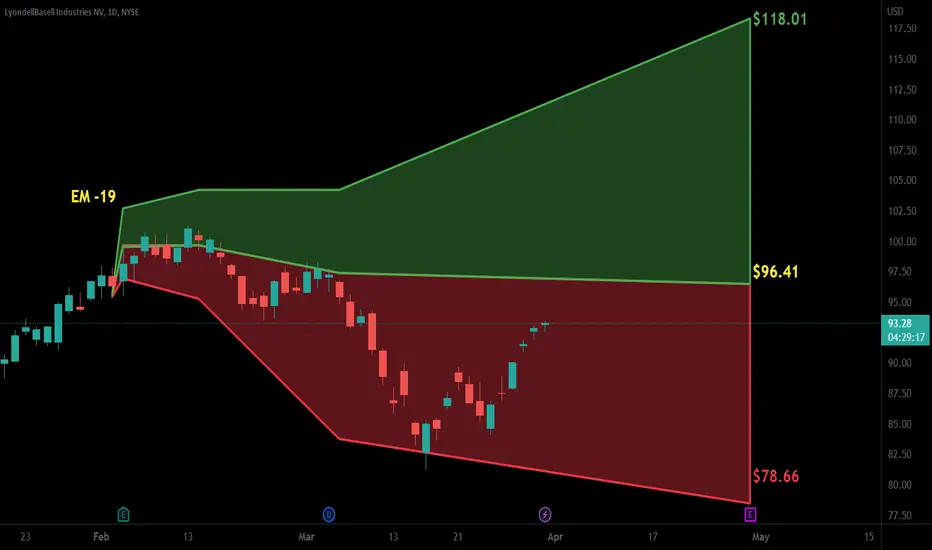
27/5/2022 NYSE (LYB)Buy (Entry Price) within the buy zone area and exit (Stop Loss) below the red line. Can take profit at the suggested Target Price.
Entry Price: $109.44 / $108.51
Target Price: $110.85 / $109.95
Stop Loss: $107.09

$LYB with a Bullish outlook following its earnings #Stocks The PEAD projected a Bullish outlook for $LYB after a Positive over reaction following its earnings release placing the stock in drift B with an expected accuracy of 100%.
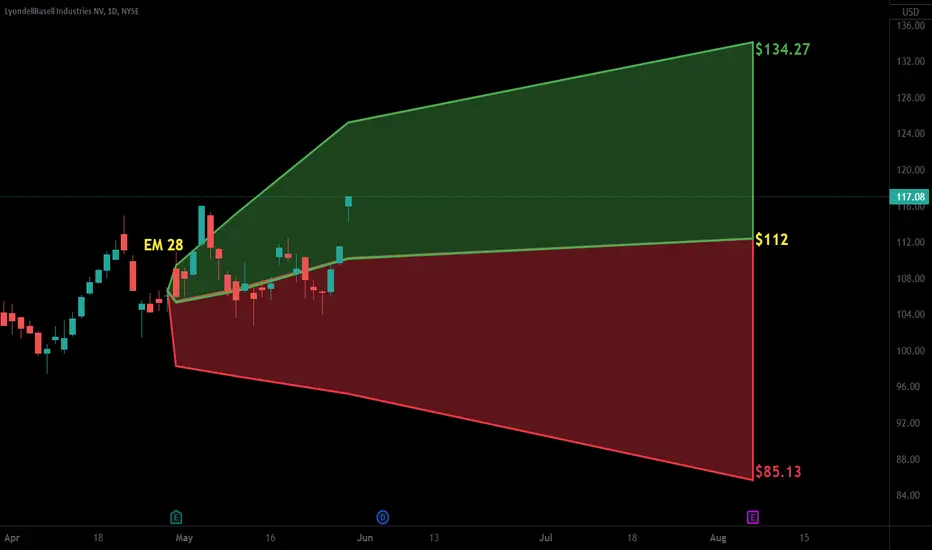
22/3/2022 NYSE (LYB)Buy (Entry Price) above the black line and exit (Stop Loss) below the red line. Can take profit at the suggested Target Price.
Entry Price: $105.11
Target Price: $107.19
Stop Loss: $101.64

LYB - LongWaiting for confirmation of price action to break trend lines (red line). Their gas division has created a beautiful set up for a breakout that is being held back by the delay in the chemical sectors' breakout.

17/3/2022 NYSE (LYB)Buy (Entry Price) above the black line and exit (Stop Loss) below the red line. Can take profit at the suggested Target Price.
Entry Price: $100.96
Target Price: $103.15
Stop Loss: $97.31

See all ideas
Trade directly on the supercharts through our supported, fully-verified and user-reviewed brokers.


Frequently Asked Questions
Depending on the exchange, the stock ticker may vary. For instance, on SWB exchange LYONDELLBASELL INDUSTRIES NV stocks are traded under the ticker DLY.
LYONDELLBASELL INDUSTRIES NV is going to release the next earnings report on Aug 2, 2024. Keep track of upcoming events with our Earnings Calendar.
DLY earnings for the last quarter are 1.14 EUR per share, whereas the estimation was 1.20 EUR resulting in a −4.94% surprise. The estimated earnings for the next quarter are 1.26 EUR per share. See more details about LYONDELLBASELL INDUSTRIES NV earnings.
LYONDELLBASELL INDUSTRIES NV revenue for the last quarter amounts to 9.00 B EUR despite the estimated figure of 8.92 B EUR. In the next quarter revenue is expected to reach 8.99 B EUR.
Yes, you can track LYONDELLBASELL INDUSTRIES NV financials in yearly and quarterly reports right on TradingView.
DLY net income for the last quarter is 167.61 M EUR, while the quarter before that showed 704.76 M EUR of net income which accounts for −76.22% change. Track more LYONDELLBASELL INDUSTRIES NV financial stats to get the full picture.
Yes, DLY dividends are paid quarterly. The last dividend per share was 1.15 EUR. As of today, Dividend Yield (TTM)% is 5.02%. Tracking LYONDELLBASELL INDUSTRIES NV dividends might help you take more informed decisions.
LYONDELLBASELL INDUSTRIES NV dividend yield was 5.20% in 2023, and payout ratio reached 76.43%. The year before the numbers were 5.66% and 39.81% correspondingly. See high-dividend stocks and find more opportunities for your portfolio.
Like other stocks, DLY shares are traded on stock exchanges, e.g. Nasdaq, Nyse, Euronext, and the easiest way to buy them is through an online stock broker. To do this, you need to open an account and follow a broker's procedures, then start trading. You can trade LYONDELLBASELL INDUSTRIES NV stock right from TradingView charts — choose your broker and connect to your account.
As of Apr 26, 2024, the company has 20.00 K employees. See our rating of the largest employees — is LYONDELLBASELL INDUSTRIES NV on this list?
We've gathered analysts' opinions on LYONDELLBASELL INDUSTRIES NV future price: according to them, DLY price has a max estimate of 112.65 EUR and a min estimate of 85.43 EUR. Read a more detailed LYONDELLBASELL INDUSTRIES NV forecast: see what analysts think of LYONDELLBASELL INDUSTRIES NV and suggest that you do with its stocks.
EBITDA measures a company's operating performance, its growth signifies an improvement in the efficiency of a company. LYONDELLBASELL INDUSTRIES NV EBITDA is 4.49 B EUR, and current EBITDA margin is 12.25%. See more stats in LYONDELLBASELL INDUSTRIES NV financial statements.