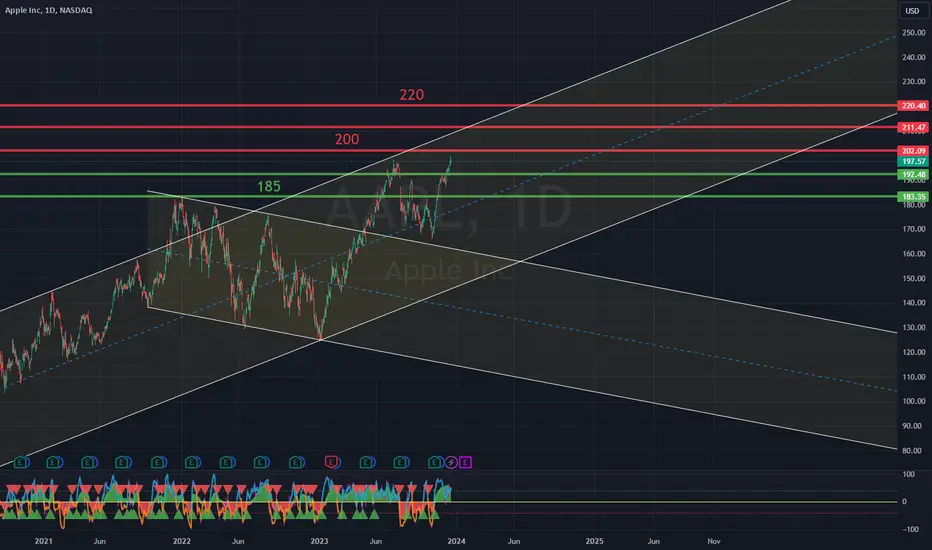
Apple Stock To Keep In Portfolio!Hello ladies and gentlemen, according to my graphical analysis of Apple , I recommend for the moment to keep Apple Stock in your portfolio because there is a great probability of reaching 200$ in the next few weeks .
APC trade ideas

What’s now, $AAPL ? [ Short-term Analysis]AAPL is currently facing a significant challenge: the 0.382 Fibonacci level in wave C, the resistance zone at the old peak, a Mean line of the W1 Channel, all converging at the current moment.
On the bullish side , one of the most encouraging signs is that the B-wave correction is not deep. This is an indication of strong upward momentum. Additionally, the momentum across M, W, D timeframes is in harmony—a reassuring signal. We cannot assert that @Apple is incapable of breaking through the confluence of resistance.
What about the bearish scenario? NASDAQ:AAPL is not responding well to this resistance confluence. Not well at all. The weekly candle couldn't close above the old peak, volume at the peak is increasing significantly, and there are signs of distribution here.
This is a delicate situation!
If forced to speculate, I would choose to SELL; however, I would prefer to stay put at this time. Whether Bull or Bear prevails for NASDAQ:AAPL , there is always a retest to give us an opportunity. Let's wait for it to happen!
WHAT A WISE TRADER DOES?
If you're holding a Buy position : Move the stop loss to a safe point to preserve profits.
If you're holding a Sell position : Set the stop loss carefully.
If you haven't done anything yet? Well, just continue not doing anything!

$AAPL BREAKOUT WATCH and MY TOP PICKSFREE #OPTIONS Ideas
Scale out when above 25% Profit
NASDAQ:AAPL 200C>198.26 | 195P<197.14
NASDAQ:MSFT 375C>371.79 | 365P<366.89
NASDAQ:AMD 141C>140.53 | 137P<137.61
NASDAQ:GOOGL 134C>133.28 | 131P<131.41
TOP Inside Bar Picks Looking for breakouts this week
KEEP THE RISK SMALL AND DONT GET GREEDY - DROP A LIKE IF THIS ADDS VALUE

The "Magnificent" 7 does not look so Magnificent.The magnificent 7 uphold a lot of weight in the QQQ, S&P Index and a responsible for a large percentage of their gains.
In fact they hold so much weight of the QQQ that if you held the Q's rather then the MAG 7 you would have earnt 1/3.
By holding the SPX you would of earnt 1/5 of the amount.
Since mid 2012.
So a underperformance of these stocks would largely drag down both index's
Other divergence to be displayed in the index.

This apple is getting rottenLOTS of greed. Good for short term pumps but eventually things are going to go bad. It's still on short term trend to hit 199 and maybe touch 200, but I'd be careful of a drop and then a bounce back as we start to head lower. If we reject off 209 and it's looking like 214 isn't possible, look for 184.

AAPL Weekly Harmonic Elliott Wave and Hurst's Cyclic AnalysisReview:
Let's review the key points of our recent updates:
November 21st:
October 26th was the first 40W trough of the current 80W cycle.
40D trough, November 27th 2023.
80D trough, first week of January 2024.
20W trough, middle of March 2024.
40W FLD target is 215.
40W trough, June-July 2024.
December 2nd:
Going back to the count of September 9th.
Wave (V) of a of 5 of (A) of 3.
Target for the peak of wave a is 202.01.
80D trough, January 4th 2024.
December 9th:
Wave 3 of c of (V) of a of 5 of (A) of 3.
Targets for wave (V) peak are 201.27 or 203.64.
December 4th was a 40D cycle trough.
A triangle for wave b of 5, January 16th 2024 is breakout time to the upside.
201-203, end of next week
Wave b is going to correct more in time than in price.
Update:
We do not need much change to our previous statements.
Analysis of the Structure:
It seems we have peaked for wave a of 5 of (A) at 199.62, a little less than our target. What follows is wave b, which I already described in my previous update why I expect it to be a triangle. Right now, we are in wave w of a of b.
Note that there is also a very little chance that we have not yet peaked for wave a. If that's the case, we would peak very early next week (201.27), then will start wave b.
The fib retracement of wave a shows two targets for wave b bottom, 191.52 or 194.61.
Analysis of the Cycles:
We are in the second 5D cycle of the second 10D cycle of the first 20D cycle of the second 40D cycle of the first 80D cycle of the first 20W cycle of the current 40W cycle.
Adding the following points to my previous cyclic analysis:
80D cycle trough expected 2nd to 16th January 2024.
We got a second upside cross of the 40W FLD this week. This gives us a range of target for the peak of 40W cycle: 215-227.

AAPL Short: Wave 1=Wave 5Well, based on my EW counts and Fibonacci extension, we have reached the target of the move up and it's time for it to go down.
Also note that the new high is NOT accompanied by an equivalent RSI(7) high. A divergence.
Also, this is all-time high. You need any reason for a better risk reward?

AAPL: Week of Dec 11 Levels for AAPL for next week.
The probability of momentum is bullish with 66% success.
On Standard Deviation, it is bearish with 59% success.
Pretty on par with what we are seeing across most stocks, signaling some selling and buying.
We sometimes see a fear sell leading into FOMC and then, you know, the moves that come after.
As always, let the PA doing the talking, watch for those conditional breaks.
Safe trades everyone!

Apple - Nothing Is BearishHello Traders, welcome to today's analysis of Apple.
I will only take a trade if all the rules of my strategy are satisfied.
Let me know in the comment section below if you have any questions.
Keep your long term vision.

AAPL: Is it over for this year?AAPL experienced a daily breakdown from a rising wedge with strong volume, indicating significant selling pressure from institutional investors. Both RSI and MACD show robust negative divergences, suggesting a lack of momentum in the recent price surge. For the bullish scenario, AAPL must return to the triangle pattern and continue its upward trajectory.
On the bearish side, today's confirmation with CPI data could trigger a major drop in AAPL's price, with a potential target in the 175-177 range.
Considering the weekly chart (see below), AAPL is rising on smaller volume and hasn't reached the upper trend line, indicating relative weakness compared to the daily chart. As the weekly chart holds more significance due to its longer time frame, there's a higher probability (70%) of a substantial drop rather than a return to the triangle pattern.

AAPL Looking longApple is looking bullish after breaching resistance and trading above so if we will get a weekly closing tomorrow above mentioned resistance can consider a long in it for the target of 230 levels.
Target Identify by two ways-:
1- One is theoretical way to measure a triangle breakout which is trading on it's all time high and no previous resistance is standing so we can use the Height of triangle from where it took resistance to swing low it made after for what are the potential target can arrived in coming sessions.
2- A rising trendline resistance I plotted on this chart, which is also adjoin the same levels where the height of triangle is indicating the coming target, so according to me the point of target is looking so logical.
Stop loss-:
So if we are going long in any of scrip I think the exit in loss (stop loss) is more important so I always believe to take and mention stop loss and that is 181 levels are looking a strong support now on weekly candle below basis which is looking a good R:R.
KINDLY NOTE-: This is not and trade or investment advice. This idea is meant for learning. Invest your capital at your own risk.
Regards-: Amit (AR)

The magnificent 7 as a comparison to QQQ.The magnificent 7 as a comparison to QQQ has currently broken out of a long term rising wedge. As expected this is a sign of momentum of a trend coming to the end. As these stocks hold up the weight of the QQQ, NDX, and S&P 500.
A break of a trend on such a wide timeframe could very well conclude any significant gains and possibly the start of another bear market.
As you can see each higher high it made the RSI diverged quiet significantly suggesting momentum each high was less significant then the previous.
I found a interesting post on Rising wedges by another Trading View member that I will post below.
However, in the short term momentum is looking bullish possibly due to equities seasonality.

buy Apple @ 200. Target 450Apple a new breakout after consolidation & rounding bottom .
best buy @ 197-200.
Target 450 in a year


Appl ideaAt the moment, Apple shares are getting the energy necessary for an upward jump towards bigger numbers. Take advantage of Apple's losses and try to take a buying position at the right time.

AaplAapl, looking for a bounce back up to 195.00 to form a right shoulder for a correction down to 182-185
The bounce back to 195 is only legit if 192 support holds..
If 192 goes before 195 then thats a double top.

Apple AAPL Technical AnalysisSee Chart Above For Analysis.
-Price inside HTF weekly/Daily supply
-Shrots valid but aggressive so need confirmation + smaller risk
-Longs valid inside demand but LTF has shown confirmation
-FED Rates Wednesday (Volatiltiy)

Apple a Case Study! Who Sold High Who Will Buy Low?High mates, Sharing weekly Chart of American tech Ginat Apple as we all know that after a parabolic run from swing lows to all time highs it has given a tremndous returns of 59% from swing low to all time high in just six months so after this heat run it became often or always seen some profit booking, fresh shorts and corrections the reason behind this can be anything but one thing is damn sure in markets that no matter how big or smart is a trader or investor till date no one has been able to sell at highs and no one has been able to buy at lows.
But with constant study and tracking the movements maybe we can get active near to highs or lows and caan make a good investment or trade, it all depends on our trading setup and mindset. So for this i marked up some S/R and key levels on chart might can help in accumulation or reversal or breakdown trade in coming sessions.
This idea is meant for learning purpose this is not a trade advice.
Best Regards- Amit

APPLE Technical top at $210.Apple (AAPL) hit on Friday our $195.00 short-term target which we called on our latest November 12 analysis (see chart below):
The rally seems far from over as the recent pull-back turned out to be only a Bull Flag pattern, which typically prompts to a continuation of the trend. Being within a long-term Rising Wedge pattern, this pull-back resembles, even on 1D RSI terms, that of March 02, only on weaker strength (reasonably as the sequences get narrower towards the end of the pattern).
That first rally of the Wedged peaked just above the 1.382 Fibonacci extension. The current sequence's 1.382 Fib is at $210.00, which falls perfectly at the top (Higher Highs trend-line) of the Rising Wedge, and that is our medium-term target.
-------------------------------------------------------------------------------
** Please LIKE 👍, FOLLOW ✅, SHARE 🙌 and COMMENT ✍ if you enjoy this idea! Also share your ideas and charts in the comments section below! This is best way to keep it relevant, support us, keep the content here free and allow the idea to reach as many people as possible. **
-------------------------------------------------------------------------------
💸💸💸💸💸💸
👇 👇 👇 👇 👇 👇

AAPL creating rising wedge patternAAPL is creating rising wedge pattern. Setting sell stop order at the previous higher low and stop loss at the last higher high.

APPLE: Short Signal Explained
APPLE
- Classic bearish pattern
- Our team expects retracement
SUGGESTED TRADE:
Swing Trade
Sell APPLE
Entry - 195.71
Stop - 198.97
Take - 188.36
Our Risk - 1%
Start protection of your profits from lower levels
❤️ Please, support our work with like & comment! ❤️

AAPL Weekly Harmonic Elliott Wave and Hurst's Cyclic AnalysisReview:
Let's review the key points of the previous update (December 2nd):
Going back to the count of September 9th.
Wave (V) of a of 5 of (A) of 3.
Target for the peak of wave a is 202.01.
Second 40D cycle of the current 80D cycle.
The 80D cycle trough is expected on January 4th 2024.
Update:
We seriously need no update as our expectations was followed perfectly (hit the play button on the previous update) and we already described the path for the weeks to come.
Analysis of the Structure:
We are in wave 3 of c of (V) of a of 5 of (A) of 3. Mt targets for wave (V) peak are 201.27 or 203.64.
Analysis of the Cycles:
December 4th was the 40D cycle trough. I have not much to add to my previous cyclic analysis. Note that the 80D cycle trough is expected on January 4th 2024, but based on some observations, I am predicting a triangle for wave b of 5, which will take until January 16th 2024 to breakout to the upside.
For now, what we care is that 201-203 is coming very soon (in the next 2 weeks, more probable is the end of next week), then we are starting a correction as wave b, that I do not expect to be deep (at least for now) and its going to correct more in time than in price.
