STORJUSDT trade ideas

STORJ.USDT (Y20.P4.E2).Macro.Looking for an entry.Hi All,
Keeping this short as its only the planning phase:
Storj did a nice reversal which was a beautiful clear setup which I missed out on, did not review the chart (bottom pattern was a reversal especially at the right fib level.) Chart below.
With a strong bounce with 4 impulses, one would think this is the top on this impulse so I'm looking for a pullback before taking the trade, as its likely to continue the uptrend in the micro level.
As the chart suggests, we can possibly have an inverted Head and Shoulder formation in the making.
Storj can still go higher so don't fomo in, look for that pullback.
On the daily chart, phoeix showing downward pressure with a current undecided candle. After 1 day, the next candle will give us the clue.
Observe the bottom formation:
================================================================
Please give me a like or tick for this post,
Regards,
S.SAri.
(ref. D.charts)
The other possibility, which I find more unlikely is a flat neckline for the inverse H & S
PREVIOUS POST was with BTC pairing
================================================================


STORJ - Potential for 20%+ swing?STORJ looks to be making moves. Taking a look at how strong it is on the 1D and 4h
We just had a bounce out of the historic "buy zone" support.
Indicators on 1D :
MACD has shrinking divergence in bullish direction.
STOCH is strong. just leaving oversold with LOTS of headroom.
Increasing volume with pumps, adds validity.
Daily high bounced off fib level, implying resistance.
indicators on 4h :
MACD has slightly shrinking divergence in bearish direction.
STOCH is overbought.
Volume decrease in last bars.
Just reached EMA 100 , it tends to play here a bit before proceeding on it's way and using it as support.
We could see a bounce back down from here, but I think long term we're good for future growth. The movement today on volume, alone with decreasing sell volume up to now plus big buy volume was pretty confirming.
If you're aiming to get in on it, expect a quick bounce down to the upper buy zone, around .38. try to get it on Try to get in on it there with a tightish SL. Once it reaches it's EMA it tends use it as support, but if it bucks that trend could be bad news.
TP's are the purple zones.

StOrJ short ideaIf BTC breaks the symmetrical triangle and mvoes down slowly it is very possible for Storj to reach the target. Good luck!


storg/usdtHigh probability of ascent after 1 hour candlestick stabilization
Hidden Divergence - Collision with the old strong Fibo 0.78 support line - Breaking the downtrend line


STORJUSDT ANALYSISThe candle is above the support line( $ 0,3979) It will be most probably open - close above the that lvl
That means you can buy when the other candle open and see what will gonna be happen if it goes down you can sell at the support line
Other case if it stay above the horizontal line ( $ 0,3979) you will see the big rise
Catch the EngineeringRobo' s buy signal
Have a good trade If you want to use EngineeringRobo please dm me.


STORJUSDT ANALYSISThe last candles crashed the resistance line(0.2970), so if the candles pass the resistance line to open and close, we should buy it. I hope it will be soon:)
I look forward:)

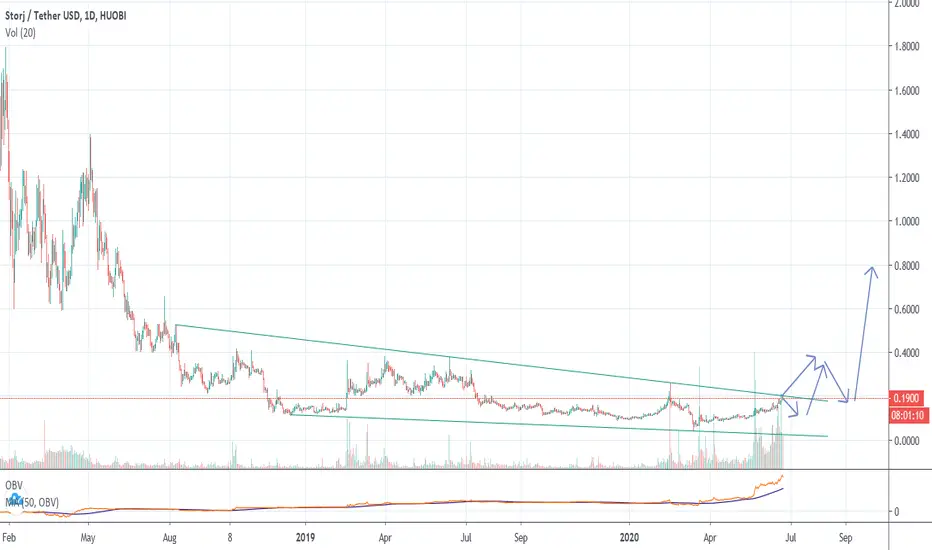
STORJ Time to buy the decentralized data storageIt is time to buy STORJ the decentralized data storage.
Alltime low bottom
Wedge
Strong accumulation with OBV rising


storj usdtpossible bullish triangle
TP: 0.95 $
Stop loss : 0.3$
See my previous analysis and leave a like and comment
