NAS100Hello guys happy new month
for the new month i am expecting prices to pullback at least to the 18000
Reasons :
1. Bullish Engulfing on the 1M timeframe
2.50% fib retracement at 18000
3.Trend line at 18000 psychological level
NDX trade ideas

NAS100 I Sentiment remains bullish I watch for these key areasWelcome back! Let me know your thoughts in the comments!
** NAS100 Analysis - Listen to video!
We recommend that you keep this pair on your watchlist and enter when the entry criteria of your strategy is met.
Please support this idea with a LIKE and COMMENT if you find it useful and Click "Follow" on our profile if you'd like these trade ideas delivered straight to your email in the future.
Thanks for your continued support!Welcome back! Let me know your thoughts in the comments!

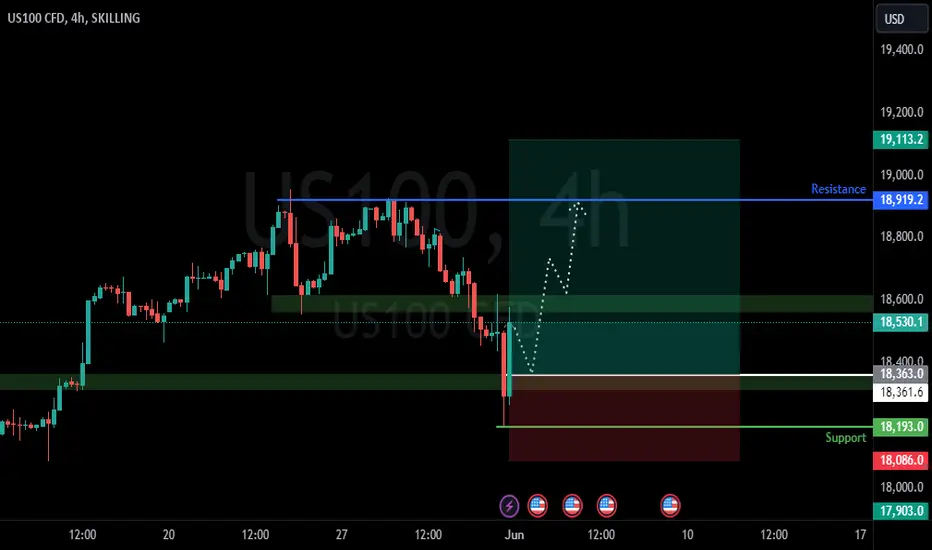
USNAS100 (BEARISH SCENARIO...)USNAS100 Technical Analysis:
The price reached the resistance line at approximately 18,920 and reversed by about -0.80%. It is now expected to retest 18,800 before continuing the bearish trend towards 18,650 and 18,550. The overall direction for today is a downtrend.
However, a bullish scenario will be activated if the price stabilizes above 18,820, targeting 18,940.
Pivot Line: 18800
Resistance Levels: 18940, 19100, 19210
Support Levels: 18650, 18550, 18440
Today's range is expected to be between the support at 18440 and the resistance at 19,100.

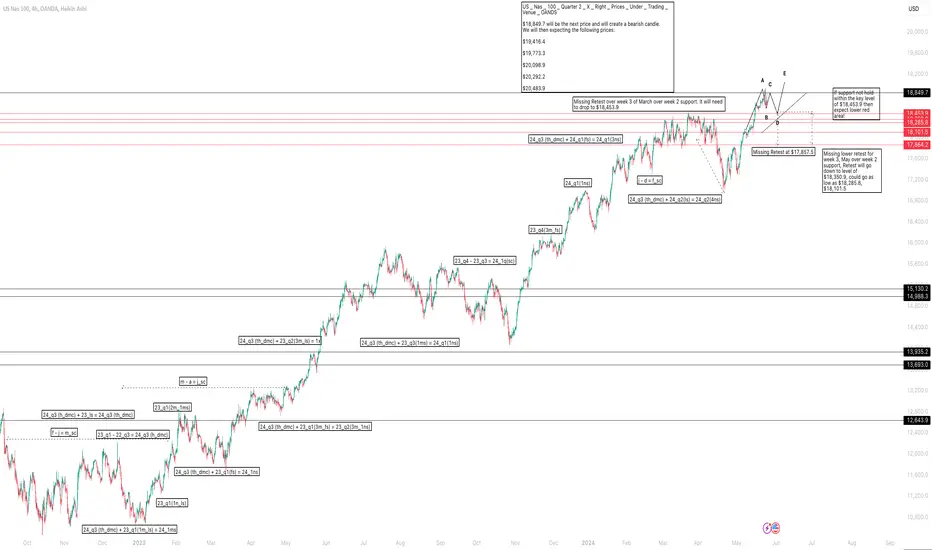
US _ Nas _ 100 _ Quarter 2 _ X _ Right _ Prices _ Under _ TradinUS _ Nas _ 100 _ Quarter 2 _ X _ Right _ Prices _ Under _ Trading _ Venue _ OANDS
$18,849.7 will be the next price and will create a bearish candle.
We will then expecting the following prices:
$19,416.4
$19,773.3
$20,098.9
$20,292.2
$20,483.9
NASDAQ Analysis - Selling OpportunityNASDAQ Analysis - Selling Opportunity
Open: 18,883
SL: 19,0000
TP: 18,480

NAS100 Bullish wave On the macro - nas 100 is currently in a bullish elliot wave
observing previous years/months its looking like the peak of the 3rd leg will be around july 2024 then retrace down until october 2024 when it will create the 4th leg to take it higher for the rest of the year into next year
Paytience pays


USNAS100 (2H, Toward Bearish Station)Technical Analysis:
For the NASDAQ, as long as the price trades below 18,820, it is likely to drop to 18,735. To continue the bearish trend towards 18,550, the price must break below 18,735. Conversely, if the price stabilizes above 18,820, a bullish scenario will be activated, supporting a rise towards 19,100.
Pivot Line: 18,820
Resistance Levels: 18980, 19100, 19210
Support Levels: 18735, 18550, 18440
Today's range is expected to be between the support at 18,550 and the resistance at 19,100.

USNAS100 (Falling Pressure...)Technical Analysis
The price dropped by approximately 1.30%, as mentioned in the previous analysis.
Currently, the price will trade between 18,435 and 18,550 until a breakout occurs.
Bearish Scenario: Stability below 18,435 will likely lead to a drop towards 18,250.
Bullish Scenario: The price must break above 18,550 and stabilize to reach 18,650 and 18,735.
The Nasdaq continues to experience bearish pressure.
Pivot Line: 18500
Resistance Levels: 18650, 18735, 18820
Support Levels: 18340, 18250, 18110
Today's range is expected to be between the support at 18230 and the resistance at 18650.
previous idea:

Pre- Market analysis for first week of June 2024Either as soon as Sunday reopens
or perhaps London KZ /NY KZ,
I'm expecting for price to come tap
the low from Friday -last day of May.
OFC wait for a 1-5min BOS upward
for confluence on entry technique.
Expecting it to eventually take May's
high but will just target this upper
area. I think 500 pips will do me just
fine.

CHART BREAKDOWN US30: Key Levels, Targets and Thoughts!Trade Update: NASDAQ
We have some great news on our recent NASDAQ trade! 💲
After analyzing the market conditions and identifying a solid setup, our trade has successfully Hit Take Profit 2 (TP2). This made sure that 80% of our positions have been secured and cashed out some of our gains, allowing us to lock in profits and reduce risk.
Following this, we moved our stop loss to TP1 to ensure no loss on the remaining position. This strategy not only protects our capital but also gives us the opportunity to capture further potential gains with zero risk on the table and cashing out on TP3s.
Stay tuned for more updates and happy trading! 🚀

nass 100 ideea just a ideea let se how it plaing out i ll wait till the trend line is break and the berish fvg is respected


US100NASDAQ Poised for Continued Upswing, Eyeing 20,650 Range
In the current market landscape, NASDAQ appears primed for further ascent, targeting the 20,650 price range. Supported by robust momentum, the index is positioned to maintain its upward trajectory. Crucially, it is residing comfortably above both the exponential moving averages (EMAs) of 21 and 90 periods, indicating sustained bullish sentiment.
The NASDAQ's resilience is underpinned by several factors. Firstly, favorable economic indicators coupled with positive corporate earnings continue to bolster investor confidence. Additionally, ongoing fiscal stimulus measures and accommodative monetary policies provide further tailwinds to equity markets.
Furthermore, the index's ability to sustain levels above key EMAs, particularly the 21 and 90-day EMAs, underscores the strength of the prevailing bullish trend. This implies that the market sentiment remains buoyant, with investors exhibiting a propensity to buy on dips, further reinforcing the upward bias.
However, prudent risk management remains imperative, as market dynamics can swiftly evolve. While the current outlook suggests continued upward momentum, potential geopolitical tensions or unforeseen economic headwinds could introduce volatility.
In conclusion, NASDAQ's upward trajectory, targeting the 20,650 range, is supported by robust fundamentals and technical indicators, with the index comfortably positioned above key EMAs. Yet, vigilance and adaptability are essential amidst evolving market conditions.

US100 NAS100 Technical Analysis and Trade Idea Taking a comprehensive view of the NAS100 (NASDAQ) , we observe a prevailing bullish trend, particularly evident when analyzing the weekly charts. Notably, we’ve identified bullish price action—a decisive break in market structure on the 4-hour timeframe—which could potentially shift the 4-hour trend to bearish in the short term before it continueds bullish. In our video, we delve into trend analysis, explore price action dynamics, dissect market structure, and introduce key technical analysis concepts. Toward the video’s conclusion, we present a trade idea. It’s essential to emphasize that this information serves educational purposes only and should not be construed as financial advice. 📈🚀📊


NASDAQ. Weekly trading levels 27 - 31.05.2024During the week you can trade from these price levels. Finding the entry point into a transaction and its support is up to you, depending on your trading style and the development of the situation. Zones show preferred price ranges WHERE to look for an entry point into a trade.
If you expect any medium-term price movements, then most likely they will start from one of the zones.
Levels are valid for a week, the date is in the title. Next week I will adjust the levels based on new data and publish a new post.
! Please note that brokers have a difference in quotes, take this into account when trading.
The history of level development can be seen in my previous posts. They cannot be edited or deleted. Everything is fair. :)
----------------------------------------------
I don’t play guess the direction (that’s why there are no directional arrows), but zones (levels) are used for trading. We wait for the zone to approach, watch the reaction, and enter the trade.
Levels are drawn based on volumes and data from the CME. They are used as areas of interest for trading. Traded as classic support/resistance levels. We see the reaction to the rebound, we trade the rebound. We see a breakout and continue to trade on a rollback to the level. The worst option is if we revolve around the zone in a flat.
Do not reverse the market at every level; if there is a trend movement, consider it as an opportunity to continue the movement. Until the price has drawn a reversal pattern.
Don't forget to like Rocket and Subscribe!!! Feedback is very important to me!

US100 BUYNasdaq looking for buy opportunity overall still in sell trend buy W pattern try to give us short term correction some took this analysis small risk 1:3 ratio

Nasdaq buy setup institutional tactics hello traders this is my nas100 buy setup
risk reward 1:10
the system: institutional tactics
if you like this deal hit the like button follow comment subscribe and show some love ❤️
wish you good luck and good trading
i would like to have conversation and share our ideas and know you good people
remember the flow state is important
Flow , Glow and know and never blow

A short term analysisUs 1 year bond is showing a strength which means dollar will or might do the same thing, expenditure of dollar will go to stock etc, on the other hand, the stock VALUE will be allocated to paper money DOLLAR
Not a financial adviice

NASDAQ Double Top 2021 + 2024Do you think "markets only go up?"
Did you know that, accounting for inflation, the nasdaq has not exceeded 2021 levels? Even with nvda and the AI rally, we're only really at 2021 levels (!!) in real dollar terms.
Here is the nasdaq price divided by US CPI. This is a potential "double top." If the fed don't move the rates down to 0% immediately, I suspect we'll see a slow grindy "deleveraging." My guess is that you're seeing a slow motion crash that could take a decade to resolve.
