CBA trade ideas


next target $74.++just my own notes, by no means trading advice to anyone. please do your own research before entering into any trade.
I think ASX:CBA shares are going to touch $74 soon.


CBA.ASX Downtrend start Best buy @ 62.61MACD supports downtrend started.
Support @64.43
Best buy point @62.61

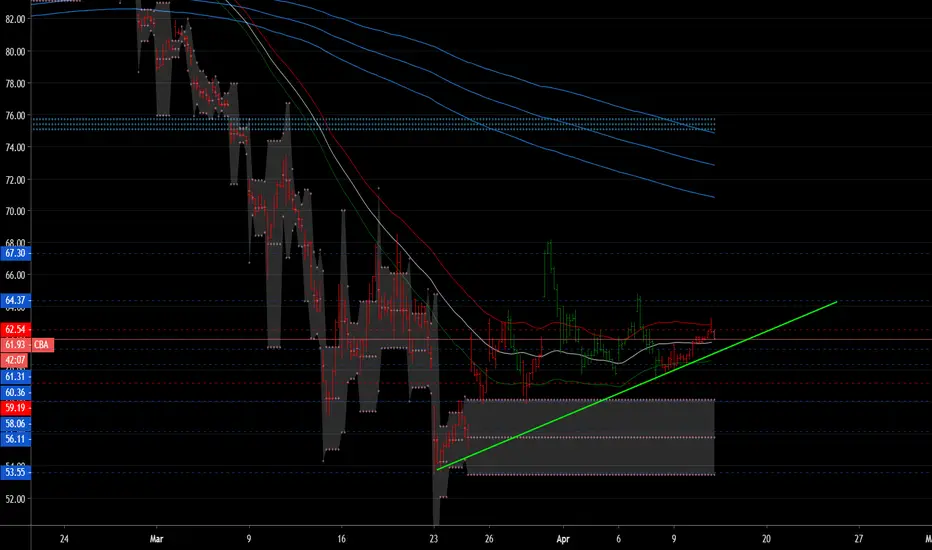
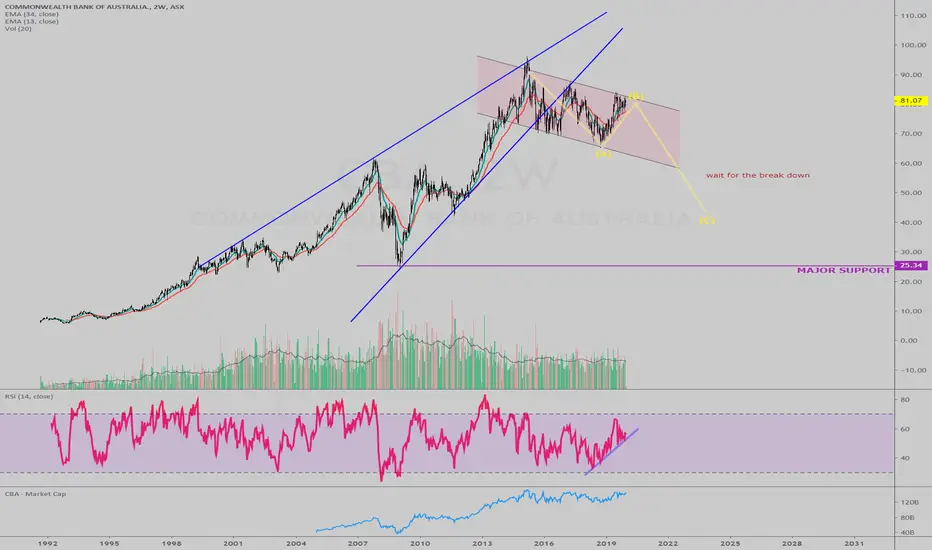
Potential long opportunityIn the weekly chart we can see that the highs in the chart is testing previous resistance points as indicated by the green arrows. However with only one retest as indicated by the little yellow arrow on the right and then it was rejected I would recommend further retests before we can confirm a breakthrough. The volume is also declining and we have potential for it to fall back to $53 which was also the resistance for 2010-2012. The RSI seems likely it would pivot but once again would need a confirmation as one breakthrough seems unlikely to last. We are also not seeing a recovery in MACD so I would recommend a wait and see mentality till there is confirmation the resistance will be breached. For entry point I recommend waiting till another retest fails and drops back down again.
*This is in no way trading advice, simply an opinion

very high probability that the price will fetch $ 64very high probability that the price will fetch $ 64

CBA (Common Wealth Bank of Australia) potential LongBuy orders set at Support Level dating back to 2012, the Level has not been tested very often, increasing the probability of a bounce. The level also acted as a strong resistance in the past. FIB level seems the most likely target for the bounce. Possible 8.5% + Trade, with high R.


Death Cross looming CBA.Death Cross 200 MA & 50 MA looming for CBA. Let's hope we get a bounce. If not see next support levels below

CBA bounce explainedCan we without any doubt attribute CBA to the RSI bullish divergence? Is it too early to say that the bounce is for sure? In any case we dont rub a crystal ball here to know what the future holds. However, one indicator showed an early sign of the recent bounce. That indicator is none else the RSI dvergence. Of course 57, recent bounce level, is in the historic R/S levels but in terms of divergence, You can see price lower lows with an RSI higher low. This theory needs to be validated in coming days. Soon I will share the targets for TP.
BANK ROBBER on the loose! - CBA AWAIT RETEST AREA over coming months, but give them hell if price signals short opportunity..


CBA to retrace back to moving average. $CBACommonwealth Bank of Australia had a good rally the last few trading days and shares likely to retrace back to the moving averages. Technical indicators such as the MACD, RSI, DMI and TD Sequentials are showing bulls are running out of energy.


CBA break downCBA broke to the down side of the rising wedge.
now price trading in a down trend channel.
chart looks bearish like WBC.
RBA cuts will not help. Its game over
for the asx200 which is basically the big 4 banks.
Commonwealth Bank of AUS to retrace back to moving averages $CBASell or Short $CBA.
Commonwealth Bank of Australia to retrace back to moving averages.
More likely to retrace back to the 200 moving average (red line) at this stage to form an ABC correction.
Or retrace back to trendline support.


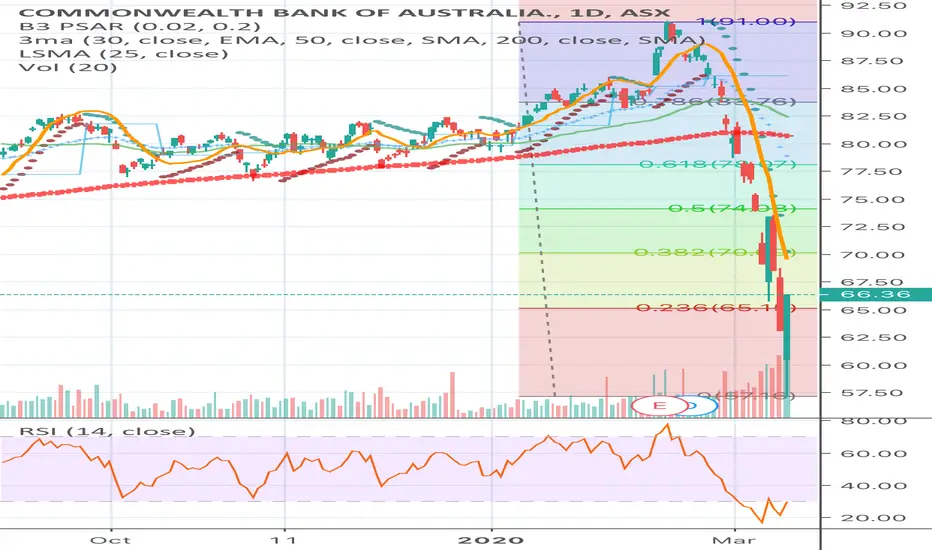
CBA.ASX finally giving inFrom everything I’ve read over the years commonwealth bank has been a widow maker for many traders looking to short. I almost bought some $65 put options earlier this year which would have expired in October. Lucky me! Any way, looks like this may finally be it. To me it looks like a big tripple top has been out in here. With the real estate market in Australia easing up a little and commbank being so heavily exposed to the housing market any dip will ravage them. Keeping in mind we have a prime minister who has taken a page out of draghis book looking to do what ever it takes to keep the Aussie housing bubble blowing.
Circled in green are our three tops. It’s also important to note the 200 weekly MA has just punched through the 20MA. There are also two lower lows as valley between our tops. A break below $70 will be the final bell.

Buy and Sell zones for Cba currently bouncing between levelsHi everybody. This is a chart showing you possible sell zones and buy zones due to resistance that we have encountered before and support which is the .618 fib level.
