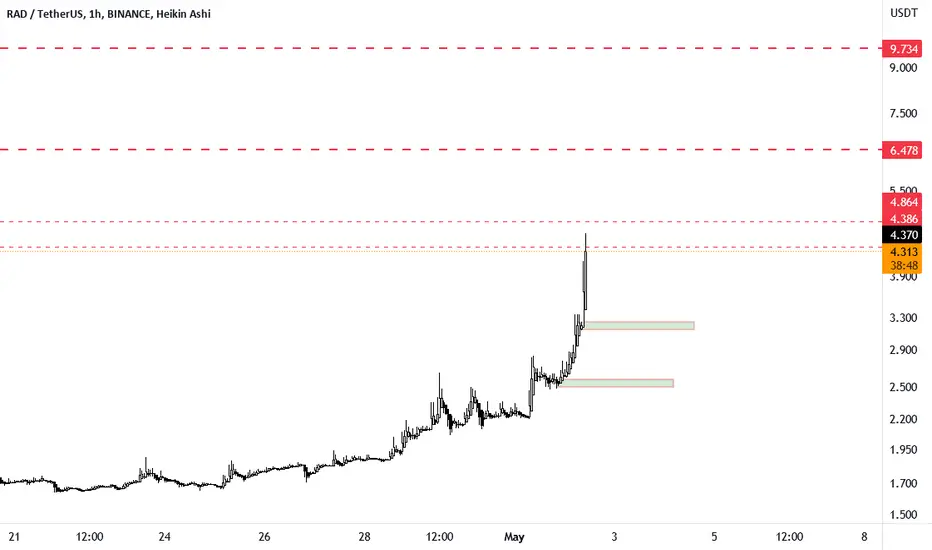
RAD beautiful bullish structurePure PA, nothing more to say, beautiful structure supported by volume.
NOT A FINANCIAL ADVICE + USE STOPLOSS AND MANAGE YOUR RISK
RADUSDT trade ideas

Radicle RAD price needs correction before continuing to growFor now, the entire cryptocurrency market is frozen in anticipation of the announcement of the new Fed rate to understand where to go from here.
RAD buyers decided that now is the best time to organize a +200% coin pump in 10 days.
What is interesting about the Radicle project? Share your thoughts in the comments.
After seeing the RADUSDT chart, do you have FOMO that you missed such growth and want to buy RAD?
Before making a trading decision, read a few theses from us:
the pumping has stopped at a liquidity level. Since the price did not go higher, it means that there will be a price correction.
It will be ideal if buyers manage to keep the price of RADUSDT above $2.75. In this case, you can try to buy RAD with growth prospects of up to $7
if the RADUSDT price will fix below $2.75, then at the chart shows buy levels below.
Of course, this is only if you believe in the positive prospects of the Radicle project.
_____________________
Did you like our analysis? Leave a comment, like, and follow to get more

Everything is going to zeroin hindsight RAD and other shitcoins pumping will be the biggest signal that the market is topped.
Sitting calmy and positioning myself for shot positions now.
Will share any short positing I'll take in future.
Trade safe and don't get rekt longing this market.

idiotidiotidiotidiotidiotidiotidiotidiotidiotidiotidiotidiotidiotidiotidiotidiotidiotidiotidiotidiotidiotidiotidiotidiotidiotidiotidiotidiotidiotidiotidiotidiotidiotidiotidiotidiotidiotidiotidiotidiotidiotidiotidiotidiotidiotidiotidiotidiotidiotidiotidiotidiotidiotidiotidiotidiotidiotidiotidiotidiotidiotidiotidiotidiotidiotidiotidiotidiotidiotidiotidiotidiotidiotidiotidiotidiotidiotidiotidiotidiotidiotidiotidiotidiotidiotidiotidiotidiotidiotidiotidiotidiotidiotidiotidiotidiotidiotidiotidiotidiotidiotidiotidiotidiotidiotidiotidiotidiotidiotidiotidiotidiotidiotidiotidiotidiotidiotidiotidiotidiotidiotidiotidiotidiotidiotidiotidiotidiotidiotidiotidiotidiotidiotidiotidiotidiotidiotidiotidiotidiotidiotidiotidiotidiotidiotidiot

Its looking like a head an shoulders is forming with radusdtOn the daily I see an inverse head an shoulders asuming the wick doesn't count the price target is $3.00 including wick an pumpermentals it could be headed around the 4.50 price target

Strong Positive Move with Key Levels of Resistance and SupportRAD is a stock that has increased by 22.89% in the past 24 hours and is currently trading at $2.235. On the daily timeframe, the stock has broken through the 0.5 Fibonacci level at $1.861 and may approach the 0.618 Fibonacci level at $1.377 if it continues to trend upward. The stock is trading close to its upper Bollinger band at $2.305 and may encounter resistance at this level. The middle Bollinger band at $1.824 may provide support if the stock begins to pull back. The RSI at 70.38 indicates that the stock may be overbought, while the stochastic oscillator at 42.25 suggests that it is starting to approach overbought territory. The EMA 50 at $1.881 may act as a key level of support on the hourly timeframe, while the 24-hour high at $2.910 and low at $1.932 may provide resistance and support levels, respectively.
Rad Breaking Out Of The Falling Wedge Seems Like ready For Massive Bullish Move
Breaking Falling Wedge In Daily Timeframe Incase Of successful Breakout Expecting 180 to 200% bullish Move

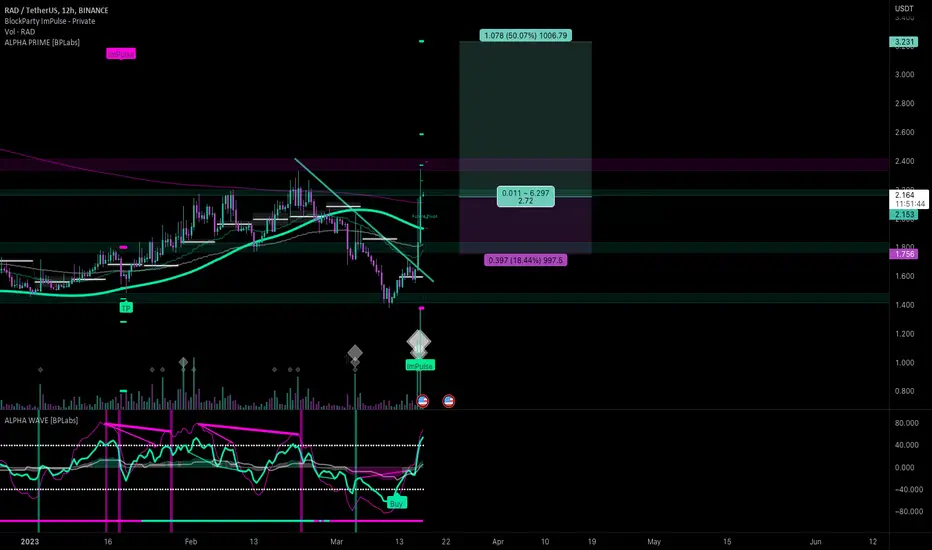
#RADUSDT - Long - Potential 50.07%Style: SWING TARGETS
Direction: LONG
Market: SPOT
Risk: 0.25% - 1%
Leverage: N/A
EXCHANGE: BINANCE
#USDT_RAD
TIMEFRAME: 720
ENTRY: 2.155
⎿ TP5: 4.31
⎿ TP4: 3.2325
⎿ TP3: 2.586
⎿ TP2: 2.3705
⎿ TP1: 2.26275
STOP: 1.756
Breakout just crossed the 200MA and got a big volume injection.
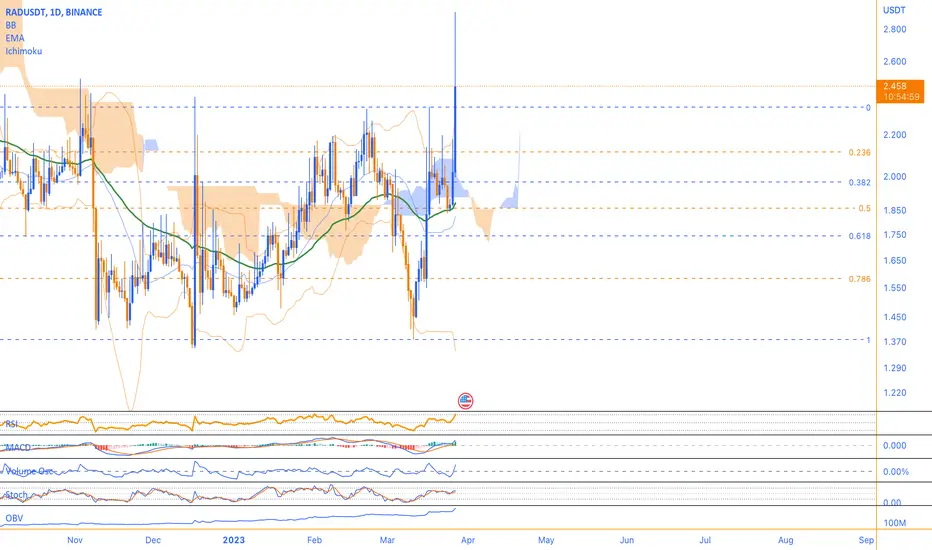
Radicle (RAD) has been on a bullish runRadicle (RAD) has been on a bullish run recently, gaining the most among other assets in the past 24 hours. The current price of RAD is $2.190, which is higher than the daily timeframe 1 Fibonacci level of $2.199, indicating potential resistance at this level.
However, the RSI of RAD is currently at 64.5, suggesting that there may still be room for the asset to gain in the short term. Additionally, the daily EMA 100 of $1.826 suggests that the asset is currently in a bullish trend.
Looking at the Fibonacci levels, the 0.5 Fibonacci level of $1.788 acted as solid support for the price of RAD during the recent bullish move. If the price continues to rise, the next resistance level could be the daily timeframe upper Bollinger band at $2.154.
The daily timeframe middle Bollinger band is currently at $1.767 and could act as a potential support level if the price experiences a pullback. On the other hand, the lower Bollinger band at $1.380 could also act as a strong support level if the price falls further.
The MACD of RAD is currently at -0.037, which suggests that there is currently no strong bullish or bearish momentum in the market. However, the stochastic oscillator is at 83, above the overbought level of 80. Traders should be aware that the stochastic oscillator can remain in overbought territory for extended periods during a strong bullish trend.
Overall, RAD appears to be in a bullish trend in the short term, with potential resistance at the daily timeframe 1 Fibonacci level and the upper Bollinger band. The support levels to watch are the 0.5 Fibonacci level, the daily timeframe middle Bollinger band, and the lower Bollinger band. Traders should also keep an eye on the RSI and stochastic oscillator for potential signs of overbought or oversold conditions.


$RADUSDT can ultra big pump any timeUltrz bullish suggest buy and hold and must SL 1.57 close 1H
Engoy

Radicle (RAD) forming bullish Gartley for upto 18.50% pumpHi dear friends, hope you are well and welcome to the new trade setup of Radicle (RAD) coin with US Dollar pair.
Recently we caught a nice pump of RAD:
Now on a 4-hourly time frame, RAD is about to complete a bullish Gartley move.
Note: Above idea is for educational purpose only. It is advised to diversify and strictly follow the stop loss, and don't get stuck with trade


Radicle (RAD) forming bullish Gartley for upto 29% pumpHi dear friends , hope you are well and welcome to the new trade setup of Radicle (RAD) coin.
On a 4-hr time frame, RAD has formed a bullish Gartley pattern.
Note: Above idea is for educational purpose only. It is advised to diversify and strictly follow the stop loss, and don't get stuck with trade


RADUSDT to the moon. #RAD $RAD min 100% pump is coming. I'm looking at RADUSDT daily chart. It is going to break multi-months log resistance. When it flips the mentioned trendline, it will explode in a crazy way. I expect min 1005 pump, my targets mentioned on the chart. $RAD chart looks like $MLN and $PHA chart. RSI and OBV looks strong as well. We need just breakout of the trendline with strong volume. Don't miss such kind of opportunity to make huge profits.

RADUSDT#RADUSDT
(LONG SIGNAL)
MACD is showing bullish
EMAs showing a bullish move
RSI is neutral
There falling wedge chart pattern and good support zone
that's give us a signal for upward move buy and holt it
to the next targets
targets set at the chart

RADUSDT#RADUSDT
(LONG SIGNAL)
There falling wedge chart pattern and good support zone
that's give us a signal for upward move buy and holt it
to the next targets
MACD is showing bullish
EMAs showing a bullish move
RSI is neutral
targets set at the chart

Radicle (RAD) formed bullish BAT for upto 73% pumpHi dear friends, hope you are well and welcome to the new trade setup of Radicle (RAD) coin.
On a 2-hr time frame, RAD has formed a bullish BAT pattern:
Note: Above idea is for educational purpose only. It is advised to diversify and strictly follow the stop loss, and don't get stuck with trade

RAD big riangleBig nice triangle on 1h chart. good consolidation. I hope it will break up this one. Good entry point imo.


RADUSDT(Radicle) Daily tf Range Updated till 27-07-22RADUSDT(Radicle) Daily timeframe range. This alt been in a very long consolidation, the pump from july 26 2022 make sense. and there are still lots of space for more progress, if retail interest picks up. Its been used heavily if you look closely you can see a loads of wicks here and there and out of place moves. of course the alt that moves it got more chance of profit. but big wicks can always trap peoples out without any problem. it makes it a high risk and reward alt.
