WTI New Trend BeginningWe can see on the 4H that the downtrend has been broken, waiting for a confirmed retest of the old trendline before entering. We could see consolidation for a little while however. Swing trade.
FRED/T10Y3M trade ideas

Is Bitcoin a leading indicator of inflation?INDEX:BTCUSD Bitcoin is regarded (in some circles) as both a store of value and an inflation hedge.
But what if Bitcoin is a leading indicator of inflation?
In the chart shown, we can see the various Bitcoin peaks over the years preceding local peaks in US CPI (orange). The US interest rate is in blue.
The last 4 peaks in US CPI YoY have occurred between 6.4 and 8.5 months after a peak in Bitcoin's price.
Specifically:
June 2016 high - 37 weeks (8.5 months) later at 2.7%
December 2017 high - 28 weeks (6.4 months) later at 2.9%
June 2019 high - 31 weeks (7.1 months later) at 2.5%
November 2021 high - 33 weeks later (7.6 months later) at 9.1%
It's also worth noting that the sequence of highs is the same; both BTC and CPI have a lower high, a higher high, lower high, then higher high.
The peaks in 2011 and 2013 coincided with CPI highs 15 and 26 weeks later, but 2016/2017 was the time when crypto first entered the public's awareness.
So why does this happen? Do Bitcoin whales buying lambos stimulate inflation?
I'm joking, but I genuinely don't know, and I hope someone can explain lol.
I've wondered if it's a case of correlation in that rising inflation is usually a sign of easy financial conditions—the ideal conditions for a risk asset like BTC to pump—with Bitcoin being the first to benefit as the ultimate risk asset (at least in the world of mainstream finance). I'm not sure though.
The most concerning thing is the implication. We recently just made another all-time high in Bitcoin, but CPI sits at 3.4% at the time of writing, having moved sideways for almost a year now.
As for whether this is a crazy coincidence, or me reaching to an astronomical degree, I don't know.
The average period of time over these last 4 periods is 32 weeks, or around October/November time. The only catalysts I see are the US government spending money like it's going out of fashion and rising commodity prices.
I'll also note that there doesn't seem to be any correlation with lows in inflation.
Personal opinion on inflation:
US inflation is stalling, rising, and falling across different measures. Producer prices, services inflation, annual PCE, and some core measures are tilting up. The only real decline recently has been core CPI.
It's also interesting to note that 1 and 5-year Michigan inflation expectations are 3.3% and 3%, respectively.
Multiple Fed officials have been hawkish lately:
Fed's Barr: Q1 inflation was disappointing, it did not provide the confidence needed to ease monetary policy.
Fed's Mester: Inflation risks are tilted to the upside.
Fed's Bostic: It would not surprise me if it took longer to get to 2% inflation in the US than elsewhere.
Given that we've reached a peak in interest rates (for the time being) but inflation has been moving sideways for around a year now, something has to change.
It could be argued that monetary policy still needs time to work, but that doesn't really mesh with measures of inflation stalling or rising over the past year. Wouldn't the lag effect continue working to drive inflation lower? Likewise, why would the US economy be growing as fast as it is?
One or more of three things will need to change: inflation, unemployment, or interest rates.
Unemployment is at 3.9%, low by historical standards but rising since early 2022.
Inflation, especially with what we've seen here, may also be on the rise soon.
If the main lever the Fed has is monetary policy, it faces a dilemma. The data doesn't support a rate cut right now, while unemployment is rising slowly. If inflation begins to rise again, it may need to hike interest rates—not ideal when Joe desperately needs one for the upcoming election.
This scenario of high inflation and high unemployment—stagflation—is what JPMorgan's CEO, Jamie Dimon, has been warning of :
'It’s a warning Dimon has issued before, previously saying he fears America is headed for a repeat of the 1970s when everything “felt great” and then quickly about-turned to a period of high unemployment and inflation paired with low demand, also known as “stagflation.”
Appearing at AllianceBernstein’s Strategic Decisions conference on Wednesday, Dimon said he simply can’t see how the past five years of massive fiscal and monetary stimulus could result in anything other than this scenario.
As it stands, the US dollar looks ready to surge higher and clear 2023 highs:
While SPY and BTC, adjusted for inflation (CPI figure taken from first day of trading), sit below their 2021 highs:
I am aware that the human tendency to look for patterns and confirmation bias may be clouding my judgement. However, in my view, the market is severely underestimating the risk of higher inflation and a potential interest rate hike, which I believe will drive the dollar higher throughout the rest of 2024.
According to the Bitcoin chart, another wave of inflation could be back above 7%+. I personally find that hard to imagine, but second round effects in the 1970s saw inflation shoot past its previous peak. Deutsche Bank has drawn parallels with the 1970s .
Long-term views:
Long USD, Oil
Short risk assets (equities, crypto)
Unsure on gold and silver but skewed lower
For these views to be truly validated, I would like to see:
TVC:DXY above 105.75
NYMEX:CL1! above 84
AMEX:SPY below 494
NASDAQ:QQQ below 414
INDEX:BTCUSD below 56,500
This is not financial advice, nor a recommendation. I wrote this to bring attention to something strange I'd found, and strongly encourage you to do your own research. Thank you for reading.

Bitcoin to 91kBitcoin is holding little down trend resistance, but it is a matter of time to break it. It is possible to see little correction to 64.5k - 65k area. Closing candle above 74k is gonna be huge sign to go up. In the end we are going to see 91k or even higher. This could be final push and after that Bitcoin could ease down a little give some chance to altcoins to go to up, to do that BTC.D ( Bitcoin Dominance ) must go down!

XLM/USD: Recent Bearish Candle on 45-Minute Timeframe Stellar Lumens (XLM), the cryptocurrency known for its fast and inexpensive cross-border transactions, has recently displayed a bearish candle on the 45-minute timeframe. This has sparked some worry among traders, prompting questions about a potential downturn for the XLM/USD pair. Let's delve into this recent development and analyze its significance within the broader context of XLM's price movement.
Understanding the 45-Minute Chart
The 45-minute timeframe offers traders a short-term view of the market, focusing on price movements over a 1.5-hour interval. It allows for a more granular analysis compared to daily or weekly charts but provides less historical context than longer timeframes. A single bearish candle on the 45-minute chart signifies a price drop within that specific timeframe. However, its significance depends on several factors.
Dissecting the Bearish Candle
The interpretation of the bearish candle hinges on its characteristics. Here's what to consider:
• Candle Size: A large bearish candle with a significant price drop carries more weight than a small one with a minor price movement.
• Volume: High trading volume accompanying the bearish candle indicates stronger selling pressure, potentially amplifying the downtrend.
• Position in Trend: If the bearish candle appears during a downtrend, it reinforces the bearish sentiment. Conversely, a bearish candle following an uptrend might be a short-lived pullback.
Is this a Sign of a Trend Reversal?
A solitary bearish candle on the 45-minute timeframe shouldn't be interpreted as a definitive sign of a trend reversal. Here's why:
• Short Timeframe: The 45-minute timeframe captures a limited snapshot of price movement. Broader trends are often better identified on daily or weekly charts.
• Market Noise: Short-term price fluctuations can be caused by various factors, including random market noise or temporary imbalances in supply and demand. These may not translate into a sustained downtrend.
Looking at the Bigger Picture
To assess the potential impact of the bearish candle, it's crucial to consider the following:
• Overall Market Sentiment: Is the broader cryptocurrency market experiencing a correction, or is the bearish candle specific to XLM?
• Technical Indicators: Analyze technical indicators on higher timeframes (e.g., daily charts) to identify potential support and resistance levels.
• Fundamental Factors: Are there any upcoming events or news stories that might influence XLM's price?
What to Do?
Traders with open XLM positions should monitor the situation closely. Here are some possible actions:
• Hodl (Hold On for Dear Life): If you believe in XLM's long-term potential, consider holding your position and waiting for the market to stabilize.
• Set Stop-Loss Orders: Setting stop-loss orders can help mitigate potential losses if the price continues to decline.
• Increase Investment (For the Bold): If your risk tolerance permits and you believe the bearish candle is a temporary blip, this could be a buying opportunity. However, exercise caution and only invest what you can afford to lose.
Conclusion
The recent bearish candle on the XLM/USD 45-minute timeframe is a cause for short-term observation, not necessarily panic. Analyze the broader market trends, technical indicators, and relevant news to make informed trading decisions. Remember, cryptocurrency markets are inherently volatile, and short-term fluctuations shouldn't overshadow XLM's long-term potential as a utility-driven cryptocurrency.

Bitcoin Price Projection: An Upward Trend on the HorizonI foresee a certain trend for the Bitcoin price. The initial level drop originated from the symmetrical triangle, leading to the formation of a ‘head and shoulders’ pattern on the 4-hour chart that has just broken. However, I don’t believe this is the end for the bulls. I’m of the opinion that there’s still another upward movement to come. In the short term, it’s possible to see the price break down to form an inverse right shoulder, which could propel us back up and out. At that point, I plan to establish a substantial long position.
It appears to be a feasible strategy to hedge short from the current level and subsequently close the position at the precise level for transitioning to a long position. This approach could potentially optimize gains if the price trajectory aligns with these forecasts. However, it is crucial to bear in mind that all investments are subject to risk. Therefore, comprehensive research and consideration of multiple factors are essential before making any trading decisions.

GBPJPY - 4hrs ( Sell Trade Target Range 300 PIP ) ☑️Pair Name : GBP/JPY
Time Frame : 4hrs Chart / Close
Scale Type : Large Scale
------
⚙️ spreading knowledge among us and to clarify the most important points of entry, exit and entry with more than 5 reasons
We seek to spread understanding rather than make money
🔗 Key Technical / Direction ( Short )
Type : Mid Term Swing
———————————
🛡Bearish Reversal
200.200 Area
Reasons
- Major Turn level
- Visible Range lvn
- Counter Trend
- Double Top Area
- Month High
- Day / week low
- Fixed Range Lvn
- Fibo Golden
🛡Bullish Reversal
196.500 area
Reasons
- Major Turn level / D
- Pattern Target
- Fibo Golden Zone
- Fixed Poc
- Quarter's Area
- Trend Area


an illustrious Samurai SwordFollow the trajectory.
Will be a money-maker!
This stock will Regain its Previous High. It is Forming a basing Pattern so many Successful stocks lay out before going on to Astounding heights.
(There is also a chance that they will beat estimates, due to easy comp's and expectations.)

Rune to Moon I am taking a contrarian view and bagholding rune... never been more bullish in my life. Love the negative sentiment I am seeing these days.
This is not financial advice I have 0 idea what rune does

OSMO Targets Last Hope for BullishnessOSMO is making new lows...
this may be good... for who likes to DCA into a falling knife (joking)
or may be pretty bad (investors lost confidence)
As we may know... if binance has not decided to get rid of a coin.. they still support the project (in some way or another).
Targets are versus BTC pair.
This may the bottom. We shall see !

Its Bullish and it's ready to 10xIQ is ready to make at least 10x, make your research and you will see why.
THIS IS NOT A FINANCIAL ADIVICE, PLEASE INVEST AT YOUR OWN RISK

Our opinion on the current state of CATCaxton (CAT) is a South African printer and publisher. This company is at the heart of the displacement of hard copy by digital and it is adjusting by reducing costs and trying to move across to digital platforms. But there has been a steady erosion of advertising revenue and even before COVID-19, the purchase of magazines has been in decline. In its results for the year to 30th June 2023 the company reported revenue up 16,6% and headline earnings per share (HEPS) up 20,2%. The company said, "Revenue grew by R995.2 million (16.6%) from R5 979.3 million to R6 974.6 million on the back of price increases to recover the large raw material input cost increases and volume increases in the packaging business, while volumes in the newspaper and commercial printing plants remained largely unchanged. The second half of the year's growth softened as loadshedding and inflationary pressures impacted consumer demand". The share broke up out of an island formation in 2021 and continues in an upward trend which is supported by its latest results.

Our opinion on the current state of BRTBrimstone (BRT) is a black-controlled investment holding company with a diverse portfolio of holdings. It owns: 1. 54,2% of Sea Harvest, which is a listed fishing company and has a market capitalisation of just over R4,5bn. 2. 100% of Lion of Africa, a loss-making insurance company, which decided in November 2018 to cease operations and close its doors. 3. 100% of House of Monatic, a loss-making clothing manufacturer, 4. 24% of Oceana, the largest fishing company in South Africa with a market capitalisation of R8,6bn. Brimstone is increasing its shareholding by buying 8m shares from Tiger Brands, which will take its holding to 22,9%. 5. 6,1% of Grinrod, 6. 18% of Aon Re Africa 7. 25% of South African Enterprise Development, 8. 49,8% of Vuna Fishing company, 9. 12,8% of Milpark Education, 10. 25% of Obsidian (a black-owned investment holding firm positioned to benefit from the roll-out of the NHI) which, in January 2020, it increased to 80% for R35,7m. and a variety of other smaller shareholdings in property, healthcare, 3,9% of Long4Life and 5,3% of Stadio. The company has been selling down its stakes in Life Healthcare, Lion of Africa, House of Monatic, Equites, Multichoice and Phuthuma Nathi. It has used the proceeds to pay down R1bn of its debt. In its results for the six months to 30th June 2023 the company reported revenue up 17% and headline earnings per share (HEPS) up 239%. The company said, "INAV at 30 June 2023 calculated on a line-by-line basis, totalled R3.07 billion, or R12.36 per share (31 December 2022: R3.29 billion or R13.25 per share), representing a decrease of 6.7% from 2022. As at 30 June 2023, Brimstone Ordinary shares were trading at a discount of 55.9% to INAV". Both ordinary and "N" shares are thinly traded, but the ordinary shares are worse. We regard the ordinary share as too thinly traded for private investors and, unless they begin to unbundle the portfolio, the extra value is likely to remain locked in.


Our opinion on the current state of CAACA Sales listed on the JSE on 27th June 2022 and traded 34 deals on the day opening at 505c and closing at 745c. The company supplies food, health, alcohol and fast-moving consumer goods (FMCG) to a wide range of companies. It is involved in warehousing, distribution, marketing and point-of-sale. In its results for the six months to 30th June 2023 the company reported revenue up 22,5% and headline earnings per share (HEPS) up 21,5%. The company said, "Revenue growth was driven by organic growth, acquisitions, expansion into new regions as well as the on-boarding of new clients to the group’s portfolio. As a result, gross profit increased by 25.9% to R786.8 million (H1 2022: R625.2 million)". This is one of the only new listings on the JSE over the past year and it is too early to assess it technically, but the has been moving sideways since February 2023. We think it will be a good investment.

Our opinion on the current state of GTC.GTC is a property group operating in central and Eastern Europe. The company has properties in Poland, Bucharest, Budapest, Belgrade, Sophia and Zagreb. It manages forty-seven office buildings and 6 retail properties with gross lettable area (GLA) of 829 000 square meters worth about 2,35bn euros. The company is listed on the Warsaw Stock Exchange (WSE) and the JSE. In its results for the six months to 30th June 2023 the company reported occupancy at 87% and a loss of 2 euro cents per share. The company said, "As of 30 June 2023, the book value of the Group’s total property portfolio including non-current financial assets was EUR 2,408m". Unfortunately, the share on the JSE is extremely thinly traded which makes it impractical for private investors.

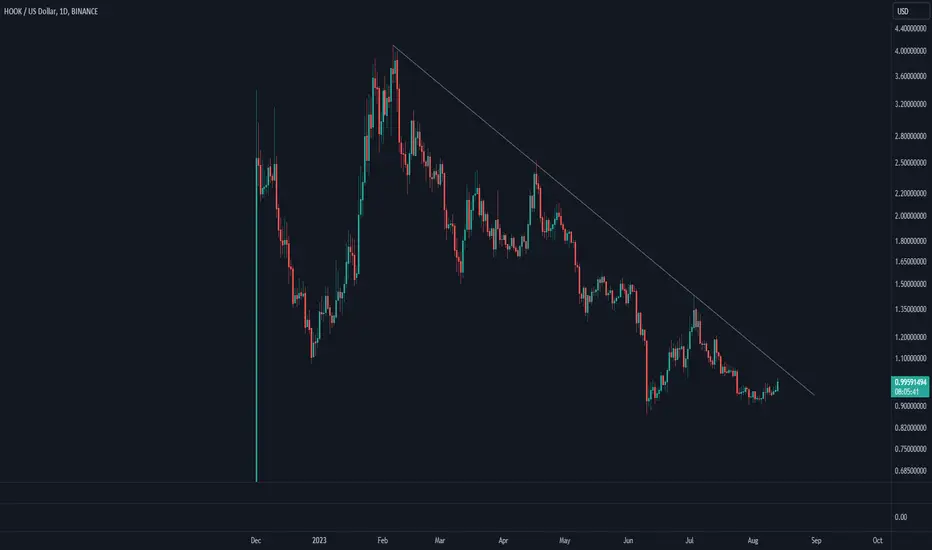
Hooked Protocol (HOOK)Hooked Protocol is a new Web 3.0 crypto project. As is it can be seen from the chart, HOOK been in a downtrend and recently price shown sign of reversal. Clearly, there is a downtrend line, and we have to wait and see if HOOK can break it or not. Let's see what happens.
Potential Breakout 😍I created this Channel is to record my trading philosophy and methods for my wife and my kids.
"The most important thing in the world is family and love!"
Nothing on this YouTube channel or any content produced by Trader Jack is meant as financial advice and/or buy and sell recommendation of any kind. It is for education purposes only. Do your own research!

GFAL - Buy Now?I see lots of comments and conversations on social medial like Twitter and Youtube about selling GFAL now and buying back later for cheaper price. hm...🤔

Insimbi showing downside to 86 centsRounding Top has formed on Insimbi after its rally from the W Formation.
21>7 - bearish.
Price>200 - Bullish
Target 86 cents
Warning is that this chart is unattractive for a trader:
It signals Illiquidity and low volume with HIGH volatility.
No matter what trade you take, I consider it a LPT (Low Probability Trade).
ABOUT THE COMPANY
Insimbi Industrial Holdings Limited is a South African company primarily involved in providing steel, aluminum, and other alloys to industries in South Africa and internationally.
Inception:
Insimbi was established in 1973, initially as a supplier of foundry and steel-making raw materials.
Public Listing:
The company was listed on the Johannesburg Stock Exchange's Alternative Exchange (AltX) in September 2008.
Expansion Through Acquisition:
Over the years, Insimbi has grown through various strategic acquisitions. For instance, in 2018, it acquired Group Wreck Non-Ferrous Metals, a company involved in the trading and processing of non-ferrous metals.

Frontier Transport classic Leave alone stockSince inception, this stock has been in a box range.
No clear direction of where the stock wants to go.
This is one of those you just leave it be.
It's unattractive, the liquidity is so low (so doubt you can enter and exit easily).
And it's one of those dead in the water stocks UnTIl...
It breaks above the Box or Below the box. But even if it breaks below the Box, there are no instruments to short as there isn't enough trading volume.

