FFBL-A bullish flag continuation pattern formingA good possible long trade expected in FFBL due to the bullish flag forming.

XAUUSD/ NEW 15 MIN POSSIBILITY price is testing 2309 resistance level on 15 min chart.if price break 2309 level it can be touch 2320 .on other hand if price rejected from 2309 its go to 2295 for support and if break 2295 level it can go to next support level at 2290.

Profited $14K, NFP is expected to rise and then fall backThis morning, I shorted gold near 2326.31, and as gold fell back to hit TP: 2315, I profited and left the market; I added positions and went long gold near 2296 and 2286, and as gold bottomed out, it hit TP again: 2300 profit and exit. The total profit exceeded GETTEX:14K , which was another good p

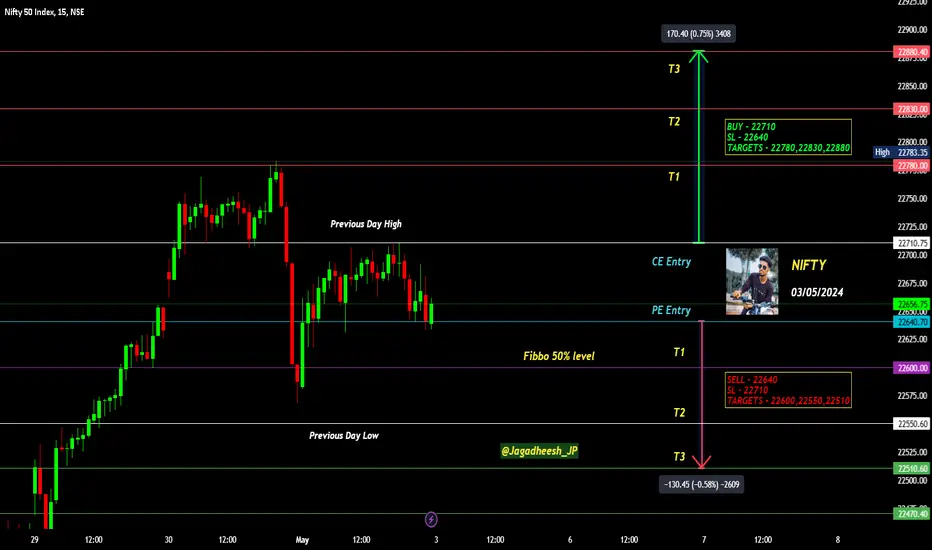
NIFTY INTRADAY LEVELS FOR 03/05/2024BUY ABOVE - 22710
SL - 22640
TARGETS - 22780,22830,22880
SELL BELOW - 22640
SL - 22710
TARGETS - 22600,22550,22510
NO TRADE ZONE - 22640 to 22710
Previous Day High - 22710
Previous Day Low - 22550
Based on price action major support & resistance's are here, the red lines acts as resistances, t
FTT/USDT Secondary trend. Wedge. Phase 3. 05 2024Logarithm. Time frame 3 days
Secondary trend. A descending wedge is being formed. Its breakthrough - reversal and price growth. Maybe another decline, take it into account in risk management. Globally, and perhaps medium urgently now acceptable prices for a position set, at least the first part of

BMR - Low Conviction play; Massive UpsideBMR - Low Conviction play
I got in at $5.91.
Here is another company that looks like it could be a monster, and has some very bullish volume, and a nice looking set up. This chart looks ridiculously bullish to me. This pole up was formed in 1 day and the EP candle closed up 371% EP. At the high o

bt usdTPrice broke strong trend ll, price 59112 accumulated stops are taken, next direction is upper liquidities, follow risk management, follow the system

Bitcoin: Dip or Bear Trap?A continuation to my last idea:
The diverging volume delta shows the selling-side domination going down.
You can see I use my Diverging Volume Delta Strategy,
like in my previous chart:
This is a short 4H-Chart analysis that indicates we might see a rise back to 60K or higher.
Disclaime

💼🔄 "ATOM Coin Analysis Update - Heavy Fall?" ⛔️📈💹 Let's delve into this cryptocurrency, ATOM, and review our previous position update. If there are new entry points, let's analyze the chart again.
🕰️ In higher time frames like the weekly, except for an event in September 2022, we're still oscillating within a box. Currently, there's no spot e


See all ideas