After being stopped out yesterday, looking for the next entry.Using Elliott Wave, RSIE, and Impulse MACD, I am waiting for the next Wave 1. Currently determining the bottom of wave c (short). on the 1 hr.. chart. Next wave is wave 1 (long).
−0.3163USD
−97.88 MUSD
264.97 M
About Global Tech Industries Group, Inc.
Sector
Industry
CEO
David I. Reichman
Website
Headquarters
New York
Employees (FY)
2
Founded
1980
FIGI
BBG000LK00C7
Global Tech Industries Group, Inc. engages in the acquisition of companies. Its subsidiaries and affiliates operate in the following sectors: intellectual properties, proprietary systems, trade secrets in the bioscience, green-tech and global health technologies, and other new and emerging businesses. The company was founded on July 24, 1980 and is headquartered in New York, NY.


Massive naked short position about to be unleashed for $GTIISome great news for the company and a great chart setup will carry this much higher. The company is literally doing everything they can to make this squeeze happen. Some people think it can make a move similar to Gamestop. Look for a breakout above the wedge.

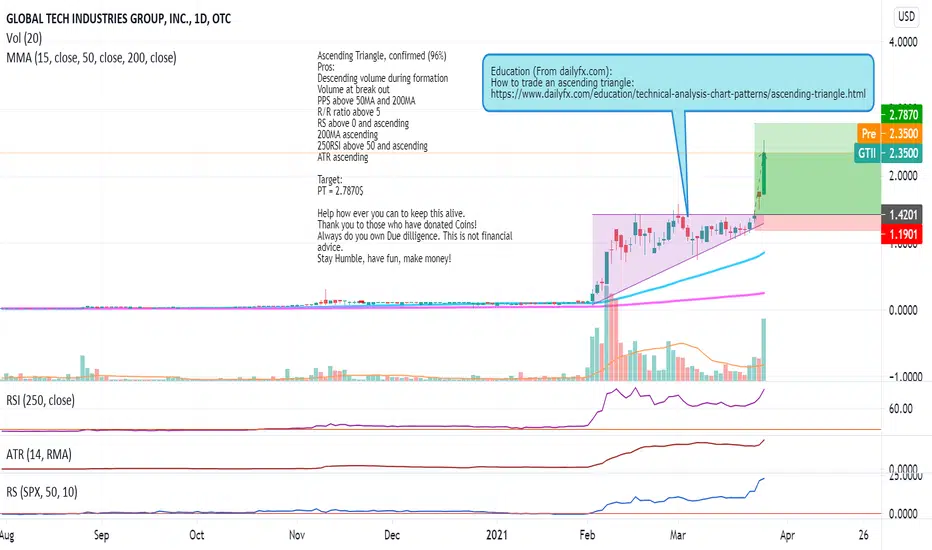
GTII: Ascending Triangle, confirmed (96%)Ascending Triangle, confirmed (96%)
Pros:
Descending volume during formation
Volume at break out
PPS above 50MA and 200MA
R/R ratio above 5
RS above 0 and ascending
200MA ascending
250RSI above 50 and ascending
ATR ascending
Target:
PT = 2.7870$
Help how ever you can to keep this alive.
Thank yo
See all ideas
Trade directly on the supercharts through our supported, fully-verified and user-reviewed brokers.


Frequently Asked Questions
The current price of GTII is 0.1620 USD — it has increased by 1.31% in the past 24 hours.
Depending on the exchange, the stock ticker may vary. For instance, on OTC exchange Global Tech Industries Group, Inc. stocks are traded under the ticker GTII.
GTII stock is 11.84% volatile and has beta coefficient of −1.24. Check out the list of the most volatile stocks — is Global Tech Industries Group, Inc. there?
Yes, you can track Global Tech Industries Group, Inc. financials in yearly and quarterly reports right on TradingView.
GTII stock has risen by 1.25% compared to the previous week, the month change is a 41.20% fall, over the last year Global Tech Industries Group, Inc. has showed a 90.00% decrease.
GTII net income for the last quarter is −17.87 M USD, while the quarter before that showed 6.70 K USD of net income which accounts for −266.88 K% change. Track more Global Tech Industries Group, Inc. financial stats to get the full picture.
Today Global Tech Industries Group, Inc. has the market capitalization of 59.92 M, it has decreased by 18.19% over the last week.
No, GTII doesn't pay any dividends to its shareholders. But don't worry, we've prepared a list of high-dividend stocks for you.
Like other stocks, GTII shares are traded on stock exchanges, e.g. Nasdaq, Nyse, Euronext, and the easiest way to buy them is through an online stock broker. To do this, you need to open an account and follow a broker's procedures, then start trading. You can trade Global Tech Industries Group, Inc. stock right from TradingView charts — choose your broker and connect to your account.
As of May 1, 2024, the company has 2.00 employees. See our rating of the largest employees — is Global Tech Industries Group, Inc. on this list?
Investing in stocks requires a comprehensive research: you should carefully study all the available data, e.g. company's financials, related news, and its technical analysis. So Global Tech Industries Group, Inc. technincal analysis shows the sell today, and its 1 week rating is sell. Since market conditions are prone to changes, it's worth looking a bit further into the future — according to the 1 month rating Global Tech Industries Group, Inc. stock shows the sell signal. See more of Global Tech Industries Group, Inc. technicals for a more comprehensive analysis.
If you're still not sure, try looking for inspiration in our curated watchlists.
If you're still not sure, try looking for inspiration in our curated watchlists.