NZDCHF - CHANGE OF CHARACTERHello Traders !
The NZDCHF price failed to create a new higher high !
The higher low is broken (Change of Character).
The support line is broken!
So, I expect a bearish move📉
----------------
TARGET: 0.55120🎯
NZDCHF trade ideas

NZD/CHF SELLERS WILL DOMINATE THE MARKET|SHORT
Hello,Friends!
Previous week’s green candle means that for us the NZD/CHF pair is in the uptrend. And the current movement leg was also up but the resistance line will be hit soon and upper BB band proximity will signal an overbought condition so we will go for a counter-trend short trade with the target being at 0.547.
✅LIKE AND COMMENT MY IDEAS✅

NZDCHF - Potential long !!Hello traders!
‼️ This is my perspective on NZDCHF.
Technical analysis: Here we are in a bullish market structure from 4H timeframe perspective, so I look only for long position. I expect bullish price action if price rejects from trendline + liquidity zone + institutional big figure 0.56000.
Like, comment and subscribe to be in touch with my content!

✅NZD_CHF WILL KEEP GROWING|LONG🚀
✅NZD_CHF is trading in a
Strong uptrend and the pair
Broke the key horizontal
Level of 0.5600 and the
Breakout is confirmed so
We are bullish biased now
And we will be expecting
A further bullish continuation
LONG🚀
✅Like and subscribe to never miss a new idea!✅

Buy The Strongest, Short The Weakest (May 23)Fundamentals & Sentiment
NZD:
- Hawkish comments from RBNZ
- Positive carry
- AUDNZD is in the mean reversion to the downside
CHF:
- SNB: "The SNB has already cut rates but it certainly sounds like there is more to come."
- Market is pricing in the cut with some more room to go (<60% chance)
Technical & Other
Setup: TC(B)
Setup timeframe: 1h
Trigger: 1h
Medium-term: Uptrend
Long-term: Uptrend
Min target: May highs
Risk: 0.43%
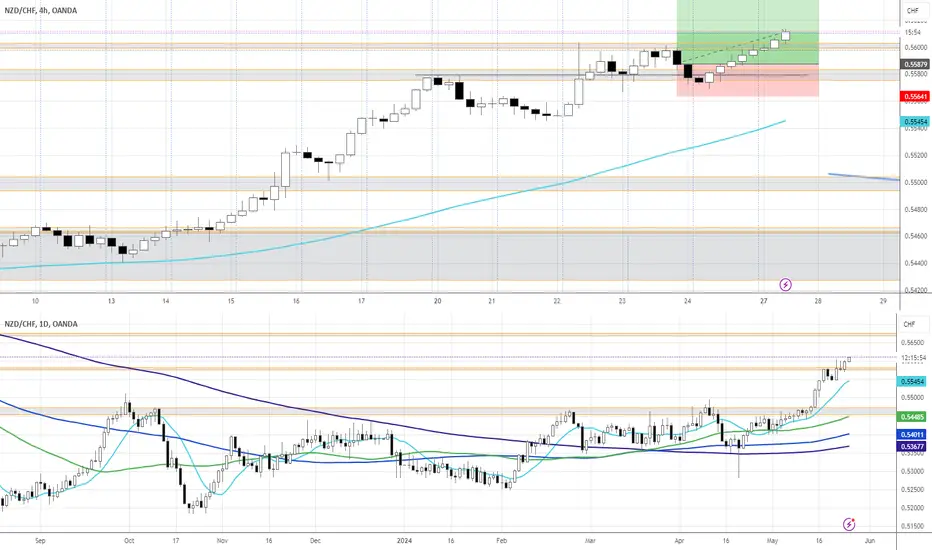
NZDCHF - Resistance Becomes Support 🚀Hello Traders !
On the daily time frame, the NZDCHF Price Broke a strong resistance level (0.55542 - 0.56043).
This key level becomes a new support level !
So, I predict a bullish move📈
------------------
TARGET: 0.56400🎯

Potential Triple Top forming, could be bearish from herePrice tested this current zone 3 times this week and couldn't push further. With XXXCHF pairs all being currently well overbought on higher timeframes, there is a possibility that this could be a point in which price retraces back down to the previous major resistance zone, which has now turned support. 0.55 would be a good place for price to retrace back to.

NZDCHF(Elliott Wave)Hello friends
In the NZDCHF currency pair, we see a very clear Elliott pattern.
In this pattern, we see either an ABC or a 3 of 5 wave.
In every 3 or C wave scenario, we see a 5th wave, the 5th wave of which has not been completed yet.
We are waiting for the completion of wave 5 of 3, and after breaking the upward trend line and pullback, we can enter the short trade.
It is possible that the 5th wave is formed as Ending Diagonal, which rarely happens, but if it happens, the price will fall quickly and sharply. Also, I remind you that Ending Diagonal is formed only in wave 5 and with the structure 3_3_3_3_3.
Probably the price will grow up to the range of 0.56500 then it will fall to the range of 0.5500.
To support me, I recommend that you install Trading View software on your phone and see my analysis and support me with your comments and Boost.
Be successful and profitable.

NZD/CHF pair for saleClassic and SMART technical analysis data
1- A bearish price channel
2- There are strong display areas
3- The emergence of a negative pattern that supports selling from current regions
4- Saturation in the price of the RSI indicator
5- Strong volume area

NZD CHF long trade of the yearNZD CHF has completed 3 wave correction on the weekly. Expect strong push to the upside on this pair. Great swing trade setup. Please confirm with your strategy before entering a trade! Let me know if you have any comments or questions ill be happy to answer them!

DeGRAM | NZDCHF pullback from a psychological levelNZDCHF is trading in an ascending channel between the trend lines.
The chart is under the psychological resistance at 0.56.
The price instantly reacted with a decline after reaching the resistance level and the trend line.
We expect a pullback after the resistance retest.
-------------------
Share your opinion in the comments and support the idea with like. Thanks for your support!

NZD/CHFBearish Divergence
Bearish divergence is a technical analysis concept indicating potential downward momentum in an asset's price, suggesting that the current uptrend may be weakening. It occurs when the price of an asset reaches higher highs, but an indicator (such as the Relative Strength Index (RSI), Moving Average Convergence Divergence (MACD), or Stochastic Oscillator) forms lower highs. This divergence between the price and the indicator signals that the bullish momentum is fading, and a reversal to the downside may be imminent.
Key Points of Bearish Divergence
1. **Higher Highs in Price**: The asset's price continues to climb, forming higher highs.
2. **Lower Highs in Indicator**: The chosen technical indicator fails to match the higher highs in price and instead forms lower highs.
3. **Potential Reversal Signal**: This discrepancy suggests that the bullish momentum is weakening, potentially leading to a reversal or a significant pullback.
Common Indicators Used for Identifying Bearish Divergence
1. **Relative Strength Index (RSI)**: A momentum oscillator that measures the speed and change of price movements. Bearish divergence occurs when the price makes a higher high, but the RSI forms a lower high.
2. **Moving Average Convergence Divergence (MACD)**: A trend-following momentum indicator that shows the relationship between two moving averages of a security’s price. Bearish divergence is seen when the price makes higher highs while the MACD line forms lower highs.
3. **Stochastic Oscillator**: A momentum indicator comparing a particular closing price of a security to a range of its prices over a certain period. Bearish divergence occurs when the price reaches higher highs, but the stochastic oscillator forms lower highs.
Trading Strategy
1. **Identify Divergence**: Look for higher highs in the price chart and lower highs in the chosen technical indicator.
2. **Confirmation**: Confirm the bearish divergence with additional technical analysis tools or patterns (e.g., trendlines, candlestick patterns).
3. **Entry Point**: Consider entering a short position when the price starts to reverse direction, confirming the bearish signal.
4. **Stop-Loss**: Place a stop-loss order above the recent high to manage risk.
5. **Target Price**: Set a target price based on key support levels or a predefined risk/reward ratio.
Example
Assume a stock is in an uptrend with the following observations:
- **Price Action**: The stock's price makes a high at $100, pulls back, and then makes a higher high at $105.
- **RSI Indicator**: The RSI reaches 70 at the first high ($100), then only reaches 65 at the second high ($105), forming a lower high.
This scenario indicates bearish divergence:
- **Higher Highs in Price**: $100 to $105.
- **Lower Highs in RSI**: 70 to 65.
Benefits and Risks
**Benefits**:
- **Early Warning**: Provides an early signal of a potential trend reversal.
- **Risk Management**: Helps in setting up trades with clear entry and exit points.
**Risks**:
- **False Signals**: Divergences can sometimes produce false signals, leading to premature trades.
- **Confirmation Needed**: It’s essential to confirm divergence signals with other technical analysis tools or patterns to reduce the risk of false signals.
Conclusion
Bearish divergence is a valuable tool for traders to identify potential trend reversals. By recognizing higher highs in price and lower highs in a technical indicator, traders can anticipate a weakening uptrend and prepare for a possible downward move. Proper risk management and confirmation with additional analysis are crucial to effectively trade bearish divergence signals.

NZDSCHF Short Set up with 3 ConfirmationsAs seen in the chart, a nice double top formation is developing. In double top patterns, it is crucial to observe divergence in the oscillators, which we can see here. Additionally, the price moving below the 50-hour moving average and the contraction of the uptrend further support my decision to enter a short trade.

NZDCHF: Long Trade Explained
NZDCHF
- Classic bullish pattern
- Our team expects retracement
SUGGESTED TRADE:
Swing Trade
Buy NZDCHF
Entry - 0.5541
Stop - 0.5511
Take - 0.5588
Our Risk - 1%
Start protection of your profits from lower levels
❤️ Please, support our work with like & comment! ❤️

NZDCHFThe Chart part is was printing HH and HL with Bullish trend after the Divergence the trend become Bearish .

NZDCHF Trading Opportunity! BUY!
My dear subscribers,
NZDCHF looks like it will make a good move, and here are the details:
The market is trading on 0.5548 pivot level.
Bias - Bullish
Technical Indicators: Both Super Trend & Pivot HL indicate a highly probable Bullish continuation.
Target - 0.5559
About Used Indicators:
The average true range ATR plays an important role in 'Supertrend' as the indicator uses ATR to calculate its value. The ATR indicator signals the degree of price volatility.
———————————
WISH YOU ALL LUCK

Potential bearish drop?NZD/CHF is rising towards a resistance level which is a pullback resistance and could fall to our take profit.
Entry: 0.55902
Why we like it:
There is a pullback resistance level.
Stop loss: 0.56759
Why we like it:
There is a pullback resistance.
Take profit: 0.54882
Why we like it:
There is a pullback support level.
Please be advised that the information presented on TradingView is provided to Vantage (‘Vantage Global Limited’, ‘we’) by a third-party provider (‘Everest Fortune Group’). Please be reminded that you are solely responsible for the trading decisions on your account. There is a very high degree of risk involved in trading. Any information and/or content is intended entirely for research, educational and informational purposes only and does not constitute investment or consultation advice or investment strategy. The information is not tailored to the investment needs of any specific person and therefore does not involve a consideration of any of the investment objectives, financial situation or needs of any viewer that may receive it. Kindly also note that past performance is not a reliable indicator of future results. Actual results may differ materially from those anticipated in forward-looking or past performance statements. We assume no liability as to the accuracy or completeness of any of the information and/or content provided herein and the Company cannot be held responsible for any omission, mistake nor for any loss or damage including without limitation to any loss of profit which may arise from reliance on any information supplied by Everest Fortune Group.

NZDCHF EVERYDAY TRADE SETUP R:R 1:3Dear All,
this my idea for sell once sell candle Confirm then i go short
this is my ideas only. what you flow your trading statistics you can continue.
you need more my ideas flow me

NZD/CHF For Bullish as Swing Tradeyou can go long now
or
wait for creating higher low (blue arrow) and go long
- General Trend is Up Trend
- NZD is good news
- Target 3 is High Monthly Resistance so be patient
have fun :)

Nzdchf sellNzdchf sell, after almost 7 months of Hhs and HLs, this pair is ready for a pullback, liquidity’s been grab, strong resistance reached and down we go baby. Risk management , happy trade guys.

NZDCHFAs price hit resistence area and rising wedge expect to fall then upppppppppp pls like for support

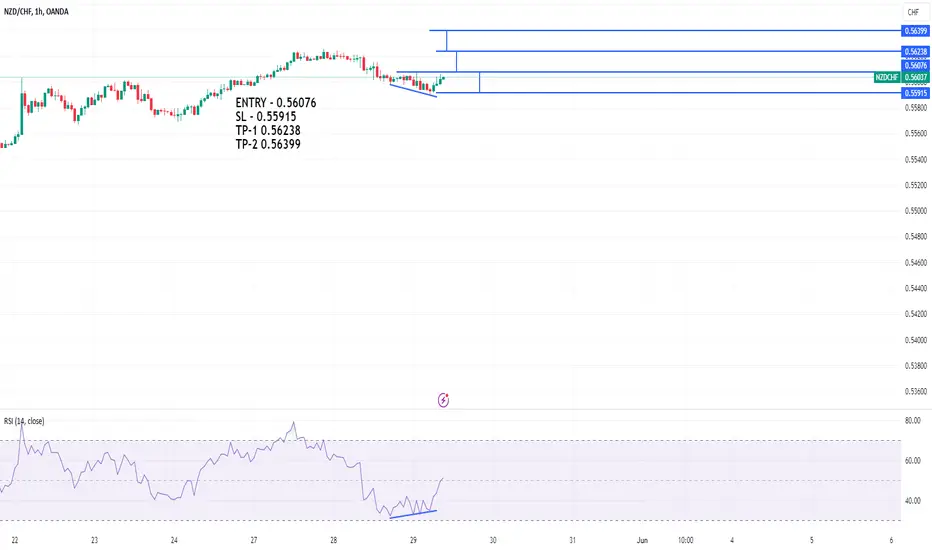
NZD CHF - 1H Time Frame - Long SetupOn 1H TF forming a bullish divergence. If we break the previous LH (0.56076).Entry / buy stop will trigger. If new lows are formed. The set up is invalidated. Good Luck
NZDCHF, targeting a +400 pip ASCEND!NZD weekly data is suggesting massive net buying / accumulation at the current price level.
Higher low formation on histogram has been created conveying the current level to be the new base for the incoming series of price growth.
Expect a more than average bounce from the present pricing.
Other key notes: Descending trendline is gradually shifting to the upside. Bubble up volume appears (bottom indicator). Huge hint.
Weekly descending trendline broken for the first time since the start of the year.
Spotted at 0.55000
TAYOR
Safeguard capital always.
