AYI trade ideas

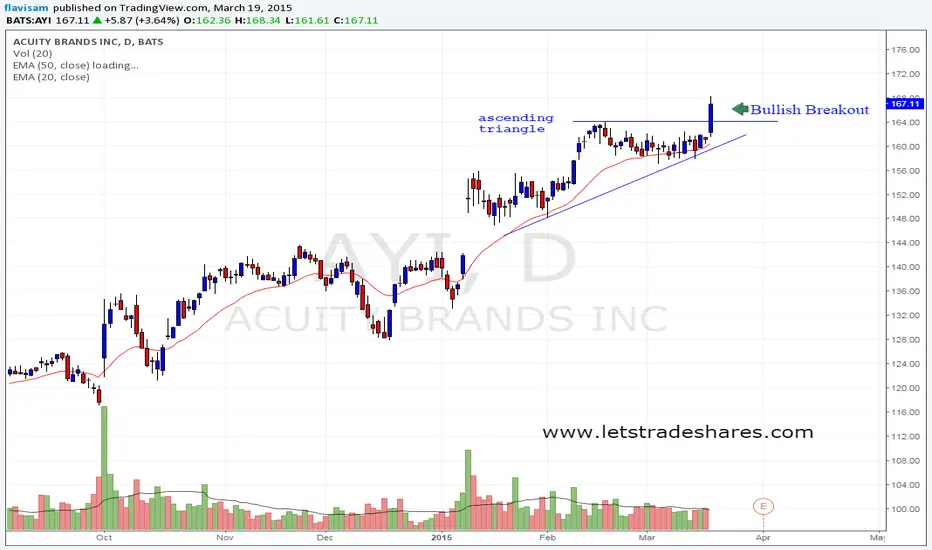

AYI measured move up to $180?AYI initially caught my eye from the daily price action. The March 2014 resistance has been retested and is now support. Price is above the $150 half figure. And yesterday's breakout bar was very bullish on higher volume.
On the weekly chart the inverted head and shoulders also stood out as a reason to go long on this stock. A measured move would take price to above $180.
However, I am not confident that the right shoulder is correctly placed. At first glance it seems an ideal formation - the second shoulder is higher (preferable in an uptrend) and the neckline is sloping up (also preferable in an uptrend). But looking at volume the second rally was down on volume, which is not what we would want to see. This leaves some doubt as to whether the measured move is valid.
Overall, this is a buy opportunity (although I will not be trading it due to the thin volume) but a target of $180 is not realistic, at this stage.


Ayi, starting an upswingThis stock is in an uptrend. It has finished a correction move, that glide the prices to the moving average.
Rebouncing now, and the buying power seems to have returned. My stop is below the last trough and my target is the same move of the last upswing


Like $ATHN and $CSGP (Other Top 10 $IWM Constituents):a Three Inside Down Pattern - This One at 7-Year Bearish Deep Crab Resistance.

Acuity Brands Inc. (AYI) potential breakout to 145-155 priceAYI volume surge upward to 201.61% yesterday which might make the price rallies to 145-155 zone according to Darvas' box system. As per Darvas, prices moving up and down the top "box" (coordinates 126-145) coupled by rising volume will trigger a potential rally. Looking in hindsight starting June 2013, "boxes" or sideways channel as per technical terms are piling up on top each other and will probably continue on. AYI has also good EPS rating , 81% compared to its group. I'll watch this stock and at the same time, setting up BUY stop order @ 143.89 using a BUY entry signal by Bill William's fractals and an initial stop loss of 127.


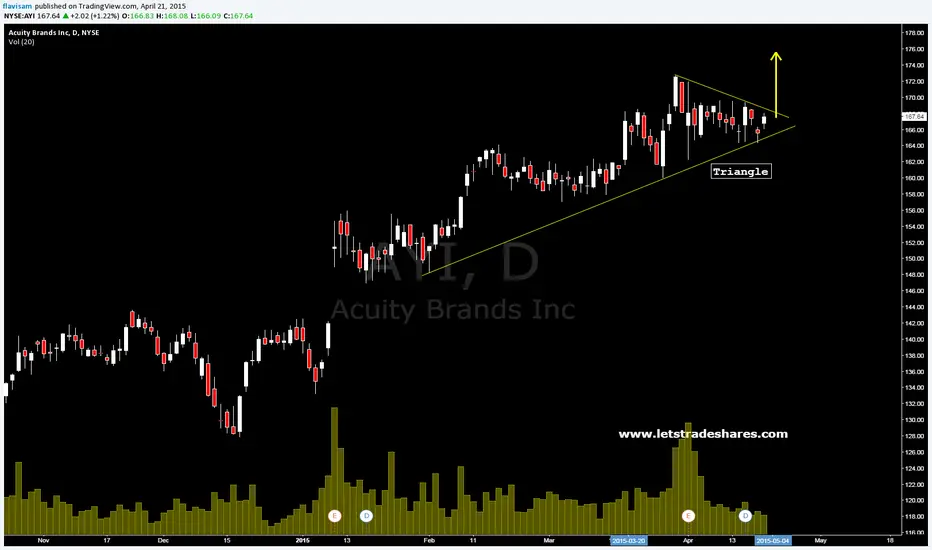
Possible AYI BreakoutAs you can see on the daily there is a good symmetrical triangle formation. The MACD indicates that there maybe a possible reversal to the positive side. Another thing we can look at is the Ultimate oscillators test of the 50line and a surge above it. It could be indicating an upside breakout as long as the 70 line isn't reached too quickly and AYI is seen as oversold.
As for the weekly and monthly views, the weekly the symmetrical triangle is slightly less present, the MACD has crossed under the trigger line and is heading towards the 0 mark, and there seems to be some bearish divergence in the Ultimate Oscillator. The monthly is a little more positives than the weekly and shows some signs of some more room left in the uptrend, however the indicators are not so strong.
For now I will leave this at a neutral prediction and monitor for the breakout.

