ALK one more move left possibly before a retrace.alk played well in the past but, this fractal looks too similar to ignore the signs.
not financial adive
ALK trade ideas


Alaska Air Group, Inc. - Looks Juicy to take a Long Position.Looking over the one week chart we can see that a bottom might be in and indicators suggest that we're in for an uptrend. Furthermore, we seem to have a prime catalyst with earnings coming up - any stroke of good news and guidance could send this thing higher. Expect a peak if other airlines do well in the coming weeks also.
RSI: Shows oversold on the weekly
Momentum: Showing that its currently trending to the upside.
MACD: Shows that we might be looking at a cross in the coming weeks making for positive upside in the future.
Will keep this updated.

ALK short term possible push to 62$Alk forming a nice bull flag possibility of the upside giving us over a 2>1 ratio only buy on the flag break target near our area 62. this move will run out of steam very soon regardless short term play only here never financial advice


Alaska Air Group, Inc.DAILY
potential head and shoulder breakout
tendency is downward.
go short if it breaks 54

Alaska Air Group, Inc.DAILY
potential head and shoulder
tendency is downward.
go short if it breaks 54

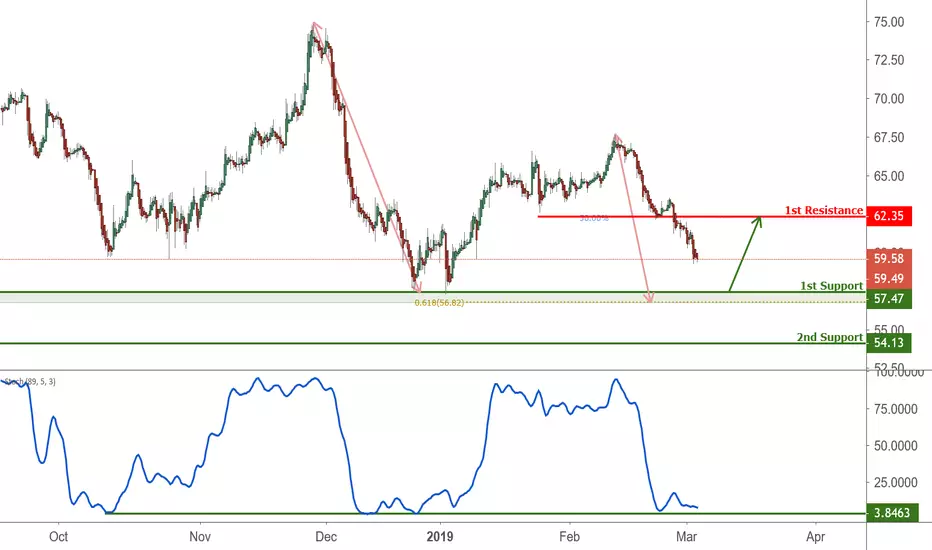
ALK approaching support, potential bounce! ALK is approaching our first support at 57.47 (horizontal swing low support, 61.8% fibonacci extension) where a strong bounce might occur above this level pushing price up to our major resistance at 62.35 (horizontal pullback resistance, 50% fibonacci retracement).
Stochastic (89,5,3) is also approaching support where we might see a corresponding bounce in price


ALK bounced from the bottom of the channelALK moving in a perfect ascending channel. Right time to jump in since the stochastic is in oversold area.
Taking profit $70-71
Stop Loss $57.5 (.5 dollars below the minimum of July)
Expecting reach the goal on January 2019

ALK Technical Breakout + RSI divergenceToday 8/24/2018- I've entered a long position into Alaska Airlines (ALK) as the stock has been trading sideways for over 200 days and seems to have a strong support at 58$( average 60$ a share). There was an resistance zone at 64.00$ and it broke through it to 68$ and has now retrace back to 64.75$ a share which could now be a new support area. Not only is the price action trading sideways and now higher, but the moving averages are starting to curve higher. The RSI is also diverging with higher highs and higher lows (triangular wedge) and the stock should find a clear path forward soon. As I am trading options, I gave myself a long expiration till January 2019 but realistically, I would like to close this position for profit in a 3-6 weeks if this stock explodes higher. I would be interested to take profits when the stock goes to 70$ - 75$ a share.
I bought a vertical call spread 60$ call/ and 70$ call for a total price of 5.16$ a contract which is $516 dollars invested. There is earnings in 62 days and this gives me a good 2 months for the stock to go above 65.16$ and then this trade can make some money. When the stock goes to 70$ a share, this trade will make atleast 150$ and that is a 29% return for the stock to only go up 7% over 2 months.


ALK - Long Term BuyALK is fundamentally cheap in terms of Price/Sales per Share and Price/CF per Share. Its hard timing buys on Valuation, but I think the chart finally looks like the downside has abated. I expect it to trade up from here.


ALK may fly very soonALK continues to show interesting development on the hourly chart, as it edges toward the apex of a very large bullish falling wedge. Earlier this week, we saw price broke down from a bearish rising wedge in an attempt to take out the downward trend line of the larger bullish wedge. The price bounced off a support level yesterday, before reaching the bottom of the wedge. It is dragged down today by the downward motion of the SPY.
However, apart from the bullish falling wedge technicals, we can see that the price has made a higher high and lower low starting at the bottom of late May. If this is a start of an uptrend, then the hourly RSI and PPO indicator actually display a hidden bullish divergence, as price made a higher low, but indicator made a lower low. This suggests that selling was so hard, but demand from below stops selling from pushing the price down. This means strength in the stock. Notice that the 9 day moving average just crossed the 50, suggesting that the near term trend is down. However If SPY happens to be down next week but ALK is green, then watch for the integrity of the hidden bullish divergence and the upward trending channel. A breakout of the falling wedge may come soon.


ALK going longgoing long
it doesn't show on this chart
but RSI is over sold
we have a nice pin bar
on support

Long term predictionEnjoy the blue skies for awhile, but don't book a ticket on the final fatal flight!

ALK - Alaska Air on the radarAlaska Air is currently trading at the top of its downtrend channel, a bearish engulfing pattern is currently forming (although we'll need to wait for the close to confirm) and the RSI has already turned down from a high level....
